Adding Context to Browser-Based Physiological Recording
In our earlier Chrome extension demo, we showed how Shimmer3R GSR and PPG data could be streamed while a participant viewed online content.
We have now extended the prototype in three main ways.
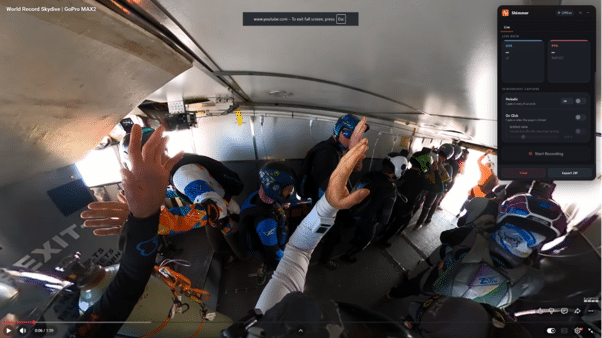
First, screenshots can be captured using different triggers, including periodic capture, click-based capture and an optional second screenshot after a configurable delay, allowing time for the view to settle after an interaction such as zooming or navigation.
Second, the recording interface is now a collapsible overlay. Researchers can connect the device, monitor live signals and configure the session, then minimise the overlay so it does not significantly interfere with the participant’s experience.
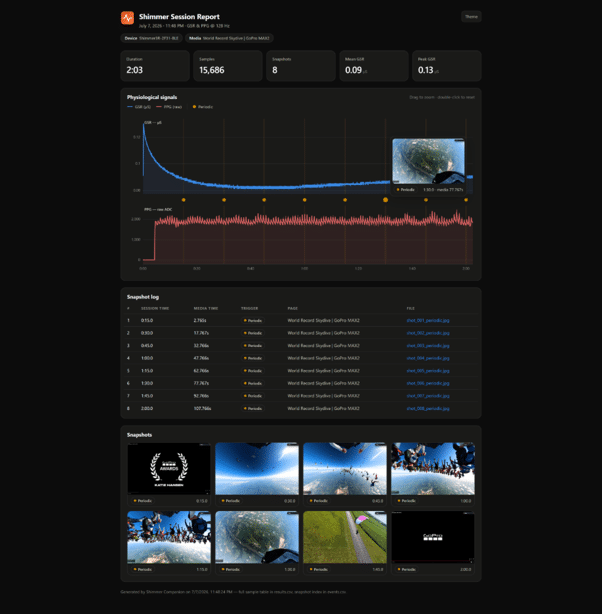
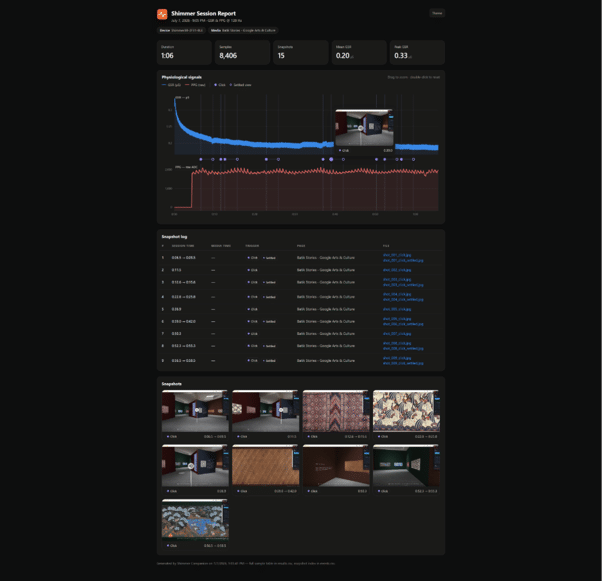
Third, the export now includes an interactive HTML report. Physiological signals are plotted against event markers, with screenshots and timestamps linked to the relevant points in the session.
Video versus interactive experiences
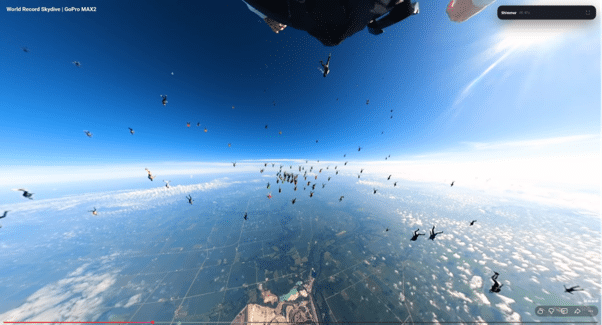
For a YouTube video, screenshots provide useful confirmation of what was visible, but they are not always essential. Because the extension records the video playback time, researchers can return directly to the corresponding moment in the video and align physiological changes with specific scenes, events or transitions.
Screenshots become more important in non-linear experiences such as a virtual museum tour. Participants may follow different routes, select different exhibits and spend different amounts of time looking at each item. In this setting, click and settled-view screenshots help reconstruct what the participant was actually viewing when changes occurred in the physiological data.
The current demo does not attempt to infer engagement, stress or interest directly. However, it provides a practical way to create richer, context-labelled datasets that could support the development of algorithms that do make those kinds of inferences in the future. By linking physiological signals with media time, interaction events and visual context, the system gives researchers a stronger foundation for building models of engagement, attention, workload or emotional response.
Where this could lead
Verisense has taught us how to manage participants, devices, data collection and processing across research studies.
NeuroLynQ Home demonstrated how participants could wear GSR sensors in their own homes while watching major media events, such as the Super Bowl, and how those individual recordings could be aggregated to understand the broader audience response.
The next natural step is to bring these two capabilities together.
By combining Verisense’s participant and study-management infrastructure with NeuroLynQ’s experience in synchronising, processing and aggregating physiological responses, we can begin building the next stage of NeuroLynQ: a platform for collecting context-rich data from distributed participants and producing aggregated response analytics for media and interactive experiences.
This prototype is an early step towards that direction.
Interested in collaborating, testing the platform or exploring a research use case?
We use cookies to operate this website, provide a relevant experience, and inform our marketing. By clicking “Accept”, you consent to the use of all cookies. By clicking "More information" you will be taken to a screen where you may configure more granular settings.
This website uses cookies to improve your experience while you navigate through the website. Out of these, the cookies that are categorized as necessary are stored on your browser as they are essential for the working of basic functionalities of the website. We also use other cookies that help us analyze and understand how you use this website. These cookies will be stored in your browser only with your consent. You also have the option to opt-out of these cookies. But opting out of some of these cookies may affect your browsing experience.
Necessary cookies are absolutely essential for the website to function properly. These cookies ensure basic functionalities and security features of the website, anonymously.
Cookie
Duration
Description
_GRECAPTCHA
5 months 27 days
This cookie is set by the Google recaptcha service to identify bots to protect the website against malicious spam attacks.
cookielawinfo-checkbox-advertisement
1 year
Set by the GDPR Cookie Consent plugin, this cookie is used to record the user consent for the cookies in the "Advertisement" category .
cookielawinfo-checkbox-analytics
11 months
This cookie is set by GDPR Cookie Consent plugin. The cookie is used to store the user consent for the cookies in the category "Analytics".
cookielawinfo-checkbox-functional
11 months
The cookie is set by GDPR cookie consent to record the user consent for the cookies in the category "Functional".
cookielawinfo-checkbox-necessary
11 months
This cookie is set by GDPR Cookie Consent plugin. The cookies is used to store the user consent for the cookies in the category "Necessary".
cookielawinfo-checkbox-others
11 months
This cookie is set by GDPR Cookie Consent plugin. The cookie is used to store the user consent for the cookies in the category "Other.
cookielawinfo-checkbox-performance
11 months
This cookie is set by GDPR Cookie Consent plugin. The cookie is used to store the user consent for the cookies in the category "Performance".
csrftoken
1 year
This cookie is associated with Django web development platform for python. Used to help protect the website against Cross-Site Request Forgery attacks
elementor
never
This cookie is used by the website's WordPress theme. It allows the website owner to implement or change the website's content in real-time.
viewed_cookie_policy
11 months
The cookie is set by the GDPR Cookie Consent plugin and is used to store whether or not user has consented to the use of cookies. It does not store any personal data.
Functional cookies help to perform certain functionalities like sharing the content of the website on social media platforms, collect feedbacks, and other third-party features.
Performance cookies are used to understand and analyze the key performance indexes of the website which helps in delivering a better user experience for the visitors.
Analytical cookies are used to understand how visitors interact with the website. These cookies help provide information on metrics the number of visitors, bounce rate, traffic source, etc.
Cookie
Duration
Description
_ga
2 years
The _ga cookie, installed by Google Analytics, calculates visitor, session and campaign data and also keeps track of site usage for the site's analytics report. The cookie stores information anonymously and assigns a randomly generated number to recognize unique visitors.
_ga_QFN96WKSJG
2 years
This cookie is installed by Google Analytics.
CONSENT
2 years
YouTube sets this cookie via embedded youtube-videos and registers anonymous statistical data.
Advertisement cookies are used to provide visitors with relevant ads and marketing campaigns. These cookies track visitors across websites and collect information to provide customized ads.
Cookie
Duration
Description
VISITOR_INFO1_LIVE
5 months 27 days
A cookie set by YouTube to measure bandwidth that determines whether the user gets the new or old player interface.
YSC
session
YSC cookie is set by Youtube and is used to track the views of embedded videos on Youtube pages.
yt-remote-connected-devices
never
YouTube sets this cookie to store the video preferences of the user using embedded YouTube video.
yt-remote-device-id
never
YouTube sets this cookie to store the video preferences of the user using embedded YouTube video.
yt.innertube::nextId
never
This cookie, set by YouTube, registers a unique ID to store data on what videos from YouTube the user has seen.
yt.innertube::requests
never
This cookie, set by YouTube, registers a unique ID to store data on what videos from YouTube the user has seen.