
Preview: this manual is being updated to cover Shimmer3R. Notes marked TODO are open questions our team is still confirming.
1. Introduction
This document is an accompaniment to the Shimmer3 GSR+ Unit from Shimmer – called “GSR+ Unit” in the remainder of this document. Its purpose is to be used in conjunction with the Shimmer GSR+ tutorial video1 to aid the user in getting started with GSR+.
The main function of the GSR+ Unit is to measure the Galvanic skin response (GSR), also known as electro-dermal resistance, electro-dermal activity or skin resistance, between two reusable electrodes attached to two fingers of one hand. In response to internal and external stimuli, sweat glands become more active, increasing moisture content on the skin and allowing electrical current to flow more readily by changing the balance of positive and negative ions in the secreted fluid (increasing skin conductance and thus decreasing skin resistance).
The GSR+ Unit provides a front-end for one channel of GSR data acquisition. The Unit also provides an additional connector for two extra channels of analog or digital2 data and provision of battery power to an external device.
The GSR+ Unit, like all Units for the Shimmer3 platform, includes an EEPROM for board identification and storage purposes.
The GSR+ Unit is connected to the Shimmer3 main board via the internal expansion connectors and is contained within the Shimmer GSR+ enclosure, with two leads connecting to the finger tip electrodes.
2. General Information
2.1. Safety Information
As a precaution, it is important to note that the GSR electrodes are not to be applied to the subject body while unit is in a USB dock or multi-charger. The use of 9″ lead wires helps to enforce this constraint.
2.2. Pre-Requisites
A GSR+ Unit programmed with appropriate firmware. For example, LogAndStream (v0.11.0 or greater) can be used to stream GSR and other data over Bluetooth or SDLog (v0.19.0 or greater) can be used to log data to the SD card; both are available for download from www.shimmersensing.com.
2 DIN snap leads
- Available for purchase on www.shimmersensing.com
GSR finger electrodes
- Supplied with the GSR+ Unit.
2.3. GSR Unit Specification Overview
Current Draw: 60µA3
Measurement Range4: 8kΩ – 4.7MΩ (125µS – 0.2µS) +/- 10%, 22kΩ – 680kΩ (1.5µS -45µS) +/- 3%
Frequency Range5: DC-15.9Hz
Input Protection: RF/EMI filtering; Current limiting; GSR inputs include defibrillation protection (survive only, not repeat).
Connections:
GSR Input 1 (Red), GSR Input 2 (Black): Hospital-Grade 1mm Touchproof IEC/EN 60601-1 DIN42-802 jacks.
Auxiliary Analog/Digital input: 3.5mm 4-position jack
Bias Voltage across GSR Inputs: 0.5V6
EEPROM memory: 2048 bytes.
Weight: 30g (fully assembled with Shimmer3 and battery).
2.4. Basic Overview
GSR measurement
The board/hardware contains an internal resistor network which works as a potential divider and provides a voltage that can be converted by the Shimmer3 ADC to a 12-bit number that represents the external skin resistance. Skin conductance can be derived from the skin resistance value, see section 3.2.
Shimmer3R: On the Shimmer3R GSR+ Unit the voltage is converted by an external 12-bit ADC (TI ADS7028) with the same 3.0 V reference, so the values and the calculation in section 3.2 are the same. The firmware’s range switching, including auto-range, is shared by both generations.
TODO(S3R): Confirm that the GSR front end (resistor network, ranges, 0.5 V bias) is the same circuit on Shimmer3R, and that the specification in 2.3 holds. The Shimmer3R GSR+ spec sheet’s table also needs correcting: its measurement-range text sits in the current-consumption row.
Typical skin resistance varies from 47kΩ to 1MΩ resistance (21µS to 1µS conductivity) (Cacioppo, Tassinary, & Berntson, 2007). The GSR+ Unit was designed to resolve skin resistance levels from 8kΩ to 4.7MΩ (125µS to 0.2µS).
3.5mm jack interface
The GSR+ Unit includes a 3.5mm jack for interfacing with external devices, such as analog or digital sensors, from which the user may wish to measure data via the Shimmer3. For more details, refer to Section 5 of this document.
EEPROM
The EEPROM device on the GSR+ Unit has 2048 bytes of memory. Shimmer uses 16 bytes to store a board identifier that defines the hardware design and revision and is useful for debugging purposes. The other 2032 bytes can be used as the user sees fit, to store calibration parameters or other data. Log and Stream firmware from Shimmer includes commands to read and write the data on the EEPROM.
3. Measuring GSR signals
3.1. Best Practice on How to Acquire a GSR signal
Full Scale Measurement Range Setting
When using the GSR+ Unit, the full scale range of the GSR sensor can be set to a number of different preset values to allow accurate results across the full measurement range. Table 1 outlines the different settings and corresponding full scale ranges.
| Range Setting | Full Scale Range | |
|---|---|---|
| Resistance | Conductance | |
| 0 | 8 kΩ to 63 kΩ | 125 µS to 15.9 µS |
| 1 | 63 kΩ to 220 kΩ | 15.9 µS to 4.5 µS |
| 2 | 220 kΩ to 680 kΩ | 4.5 µS to 1.5 µS |
| 3 | 680 kΩ to 4.7 MΩ | 1.5 µS to 0.2 µS |
| 4 | Auto-Range | |
As can be seen from the table, the Full Scale Range can be set to Auto-Range which will set the range to the value most suitable to the current reading, based on pre-determined transition points. Settings 2 and 3 provide the best match for typical tonic skin conductance values. For more information on how to change the setting, refer to Section 7 (Firmware Considerations).
Sampling Frequency
Although the sampling frequency is entirely up to the user, relatively low sampling rates are suitable for GSR applications. 0-5 Hz is suggested for tonic measurements, with 0.03-5 Hz being adequate for phasic measurements (Geddes & Baker, 1989). See Section 3.3 for a note on using high sampling frequencies with the auto-range setting.
Electrodes
For GSR it is recommended to use snap connector Ag/AgCl electrodes. The surface area of the electrodes should be kept to a minimum; 1 cm2 are ideal. Re-usable Velcro strap electrodes are useful but sticker electrodes will also work once positioned correctly (Fowles, et al., 1981).
Electrode Positioning
One electrode should be placed on the palmar surface of the medial phalange and the other on the palmar surface of the distal phalange (Malmivuo & R., 1995). Alternatively, the electrodes can be placed as in Figure 3‑1, below.
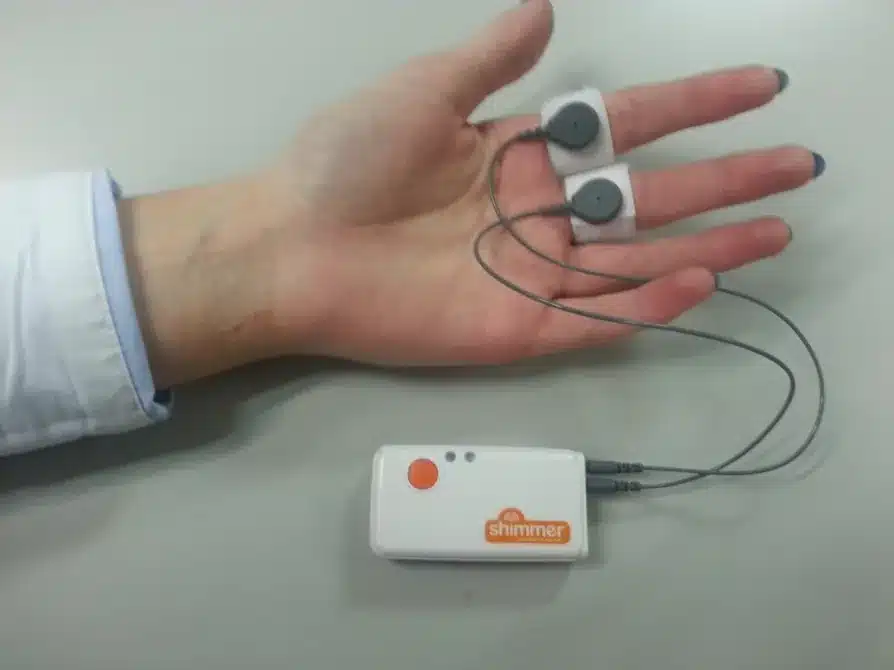
Figure 3‑1: Example electrode positioning for GSR
3.2. Calculating Skin Resistance
If you are not using Shimmer software for your GSR data acquisition, you will need to calculate the skin resistance from the ADC values. The Shimmer has a 12 bit ADC which means it reports values from 0 to 4095. The calibration equation to convert from the ADC output to the skin resistance is as follows:
Rs = \frac{Rf}{\frac{ADCValue*(\frac{3v}{4095})}{0.5v} - 1}Where:
- $`\mathbf{R}_{\mathbf{f}}`$ is the value of the feedback resistor, in Ω, used by the sensor for a given range.
| Range Setting |
math \mathbf{R}_{\mathbf{f}} | |:—————–:|————————-| | 0 | 40,200 Ω | | 1 | 287,000 Ω | | 2 | 1,000,000 Ω | | 3 | 3,300,000 Ω |
Table 3‑2 The feedback resistor value for each range setting.
ADCValue is the 16 bit output of the ADC (i.e., uncalibrated GSR value).
RS is the measured value of skin resistance in Ω. (With a range of 10 kΩ to 4.7 MΩ)
3v/4095 is the voltage per bit of the ADC, where the reference voltage of the ADC is 3.0 volts and the 12‑bit ADC has 4096 different measurement levels.
0.5v is the reference voltage used by the sensor.
Skin conductance (G, measured in Siemens) can be calculated from skin resistance (Ω) using the following equation:
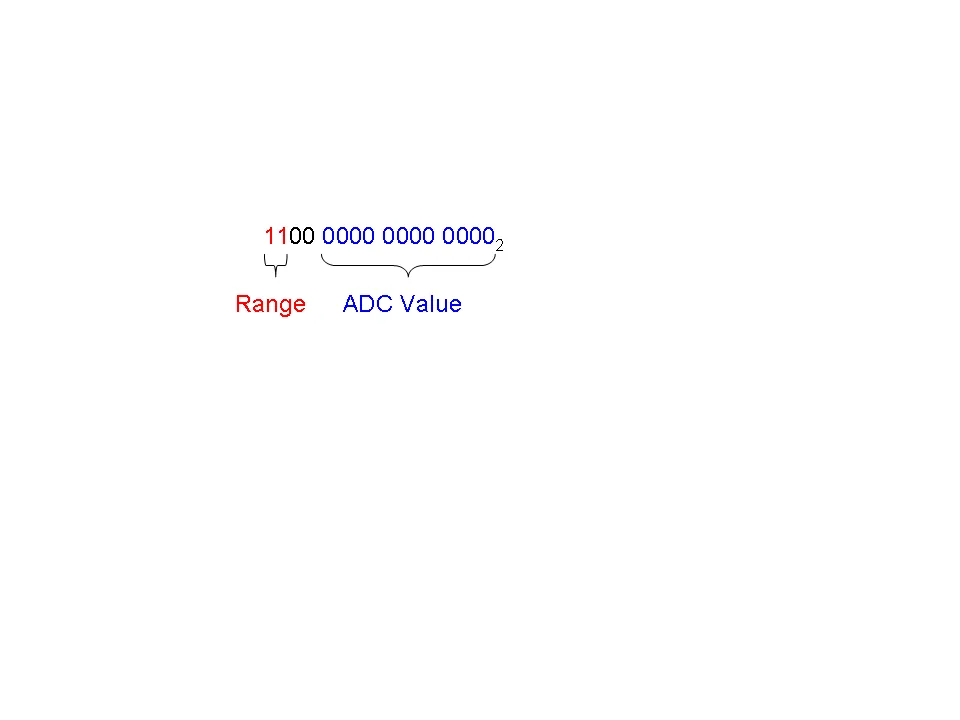
G = \frac{1}{R_{S}}The current range of the Shimmer’s GSR hardware is indicated by the two Most Significant Bits of the Shimmer’s uncalibrated output value; the twelve Least Significant Bits give the ADC value. For example, the 16-bit Shimmer output value 1100 0000 0000 00002, shown below, has a range of 3 (indicated by the two bits in red) and an ADC value of 0 (indicated by the twelve bits in blue).
3.3. Auto-range and high sampling frequency
If you choose to sample at a higher frequency than the range recommended in Section 3.1 and you also choose the auto-range setting, there will be minor discontinuities in your data at the points where the range changes. This is due to the bandwidth of the hardware (max frequency is 15.9 Hz) and the settling time of the circuit after a hardware resistor switch. When a range change occurs, the Shimmer firmware should duplicate the most recent valid ADC output value for all samples during the settling time (approximately 80 ms) and then step to the current ADC output value once the circuit has settled.
This does not have any effect on GSR data because the frequency range of interest for GSR is much lower than the auto-range settling frequency. However, it is important that you recognize its occurrence on your high frequency data and do not confuse it with a GSR event. Alternatively, applying a simple low pass filter to the skin conductance or skin resistance output will eliminate the effect of transitions.
Note: do not apply the low pass filter to the ADC output value as this will reintroduce the switching-induced settling error.
4. The GSR Signal
GSR is a measure of skin conductance (and, hence, its inverse is skin resistance). The conductance values from the GSR sensor will depend on the amount that a person sweats; the more the person sweats, the higher the conductance and, conversely, the lower the resistance will be.
The GSR signal, sometimes known as Electro-dermal Activity (EDA), is composed of both tonic and phasic components. The slowly varying base signal is the tonic GSR part, also called the skin conductance level (SCL). The faster changing part (phasic activity) is related to external stimuli or non-specific activation. The main challenge with GSR analysis lies in interpreting the reasons for the increases and decreases in sweat levels. The following serves as a high level introduction to some of the components that make up GSR signals, with a very brief discussion on how they might be interpreted to evaluate emotional arousal. It is intended to provide initial guidance for new users, with some pointers to what may be useful literature.
4.1. Baseline
There are variations in the “baseline” skin conductance value due to factors like temperature (which causes the body to sweat more or less for thermoregulation), dryness of the skin (dry skin is a bad conductor) and other physiological factors which differ from person to person.
4.2. Responses to stimuli
GSR responses will be observed due to almost any stimulus in a person’s environment, for example, sight, sound or smells, and also due to “internal” stimuli which can largely be interpreted as “emotion”, e.g. stress, excitement, nervousness, concentrating on a task. For example, if a person sits in a generally quiet room and relaxes, events like a phone ringing in the background can cause noticeable GSR responses. Similarly, thinking about something exciting or stressful, or carrying out a task that requires concentration, will also cause a noticeable response. These responses cause a rapid increase in conductivity followed by a slow return to baseline. Multiple stimuli in quick succession will be superimposed in the GSR signal so that individual spikes may not be distinguishable without applying signal processing methods to separate them.
Figure 4‑1 shows an example of the GSR signal recorded from a subject in a quiet room, watching a video of two people base-jumping from the highest building in Dubai (video here7). The figure is annotated with some of the most significant events from the video. Before the video was started, the subject was instructed to relax; this period corresponds to a slowly decreasing conductance level. At approximately 3 minutes, the subject was instructed to rub their fingers together rapidly to demonstrate the effect of minor motion artifact (see Section 4.3).
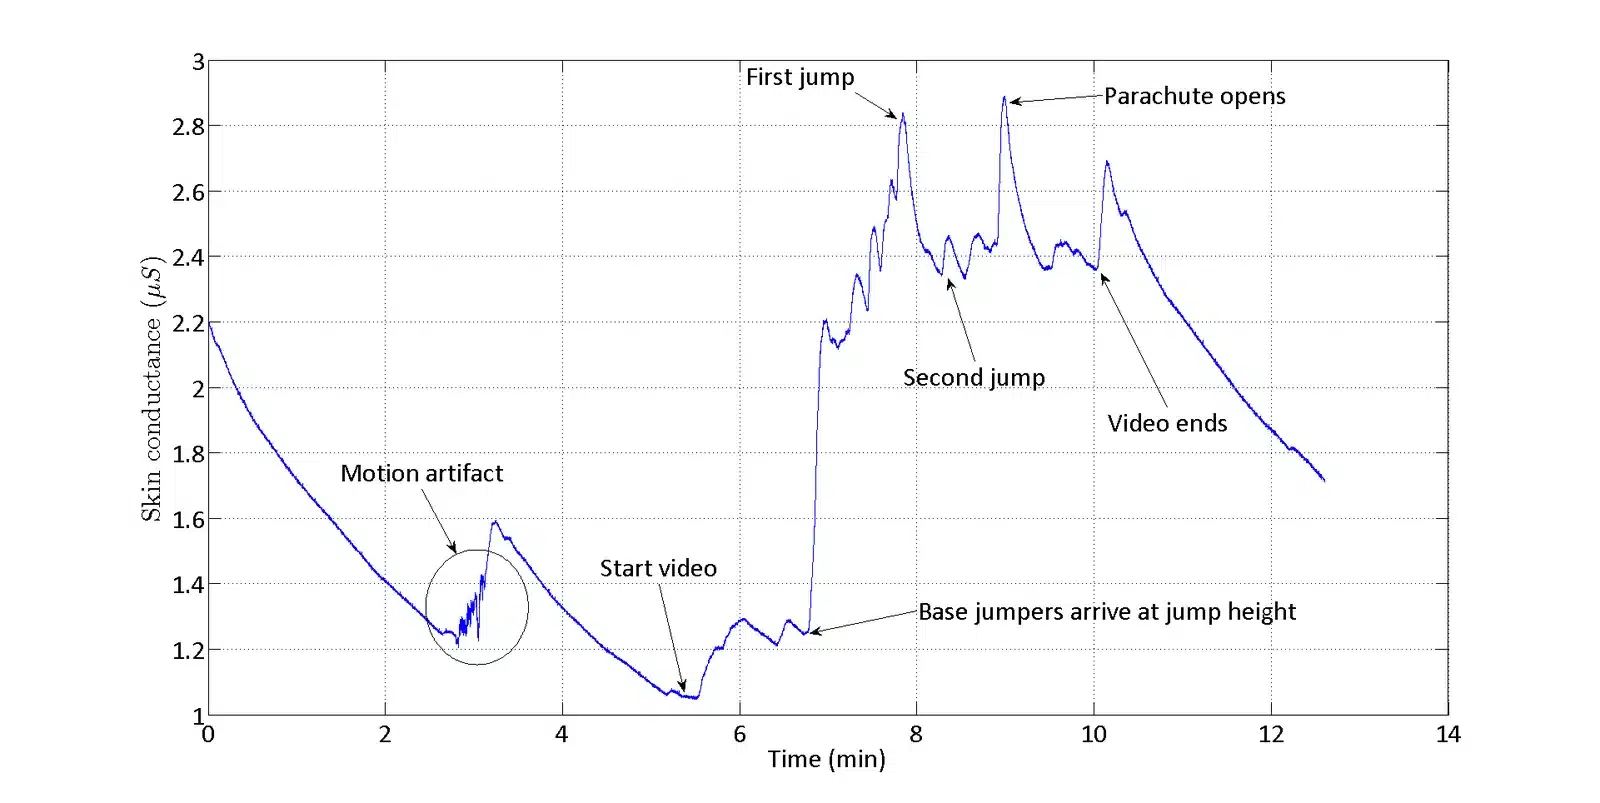
Figure 4‑1: Example of GSR signal – subject watching a “nervousness-inducing” video
4.3. Noise and motion artifact
As with any sensor which uses electrodes connected to the skin and where there is movement at the site of the electrodes, there will be motion artifact present in the signals. This effect can take the form of a high frequency noise-like component in the recorded if the electrodes aren’t tightly attached and lose contact with the skin during movement – even partially losing contact will cause this effect. Furthermore, if the electrodes are pressed tightly into the skin, they will have better contact and, hence, will measure a higher conductance value, compared to a looser connection.
Usually, efforts are made to avoid these effects by attaching the electrodes as securely as possible. It would also be advisable to avoid movements that cause the velcro straps to rub together causing the electrodes to move (resulting in the motion artifact shown in Figure 4‑1).
A low pass filter should be applied to the data to remove high frequency noise which can be attributed to movement artifact and other noise components. A cutoff frequency of as low as 1 – 5 Hz can be used without affecting the data of interest due to the slowly varying nature of GSR responses.
4.4. Analysing and interpreting GSR signals to measure emotional arousal
Because “arousal” is a very subjective phenomenon, caused by many different factors and felt as many varying emotions (e.g. sadness, happiness, excitement and anger are all forms of emotional arousal), a direct conversion from physical units of conductance to any unit of “arousal” is not meaningful. It is more meaningful to look for changes in GSR, rather than trying to interpret the absolute values.
A common approach taken in the literature is to separate the slowly-varying “tonic” or baseline response, which can largely be attributed to skin condition, temperature, etc., from the rapidly-varying “phasic” response, which is made up of responses to specific or non-specific stimuli. Many methods for separating the tonic and phasic components exist, with some examples found in (Lim, et al., 1997), (Benedek & Kaernback, 2010) and (Bach, Flandin, Friston, & Dolan, 2009).
The more variation that occurs in the phasic component of the signal, the more “aroused” the subject is likely to be. This can be observed in Figure 4‑1, where a clear increase in high frequency activity is seen for the period while the subject was watching the video (i.e. under the effect of stimuli), compared to when the subject was relaxing at the beginning of the recording.
Correlating the level of activity to mood or state-of-arousal is a complicated task and the subject of recent research interest. An example is the use of classification methods from the field of machine learning, such as k-nearest neighbour classification of features extracted from the data, as in recent work by Greco et al. (Greco, et al., 2012).
5. Using the 3.5mm jack interface
In addition to the GSR connections, the GSR+ Unit has a 3.5 mm 4-position jack that can be used to interface external sensors with analog or digital channels on the Shimmer.
In analog configuration (the default configuration for all shipped units), the jack provides an interface with channels A12 and A13 of the ADC. In digital configuration8, the relevant connections are SB_SDA and SB_SCL, respectively.
Shimmer3R: The same two jack inputs are named Int A0 (Shimmer3 Int A12) and Int A1 (Shimmer3 Int A13) in Consensys and the Shimmer APIs, because Shimmer3R reads them through an external ADC. Wherever this guide says A12 or A13, select Int A0 or Int A1 on a Shimmer3R.
TODO(S3R): Confirm that the jack’s digital configuration (SB_SDA/SB_SCL) exists on the Shimmer3R GSR+ Unit.
The 3.5mm jack also includes a 3V connection to power an external sensor, which can be enabled or disabled, as necessary, via the Shimmer3 firmware.
5.1. Example: Optical Pulse Sensing via GSR+ Unit
One possible use of the 3.5mm jack is to interface with an optical pulse sensor, such as the one which can be purchased on the Shimmer website. The Shimmer Optical Pulse Sensing Probe provides a photoplethysmogram (PPG) signal from a finger, ear-lobe (or other capillary tissue location on the body), which, with some processing, can be used to estimate pulse, or heart-rate. Such a configuration extends the capability of the GSR+ Unit to provide a comprehensive emotional response solution.
The Optical Pulse Sensing Probe that ships from Shimmer has the PPG signal connected to pin 2 of the 3.5mm connector. This should be used with a GSR+ Unit in analog configuration (see Section 6.2 for configuration options), such that the PPG signal will be connected to the A13 channel of the Shimmer ADC.
Shimmer3R: On a Shimmer3R GSR+ Unit, select the PPG input Int A1, which is the same jack pin. In Consensys the PPG input choice “Int A13 / Int A12” on Shimmer3 appears as “Int A1 / Int A0” on Shimmer3R.
The 3V expansion power pin must be enabled for data acquisition from the optical pulse sensor. This can be achieved via any of the Shimmer APIs or Instrument Drivers (available for LabVIEW, MATLAB, C# and Android) and all Shimmer Software including ConsensysPRO as illustrated below in Figure 5‑1. Please see the documentation for the relevant product for details.
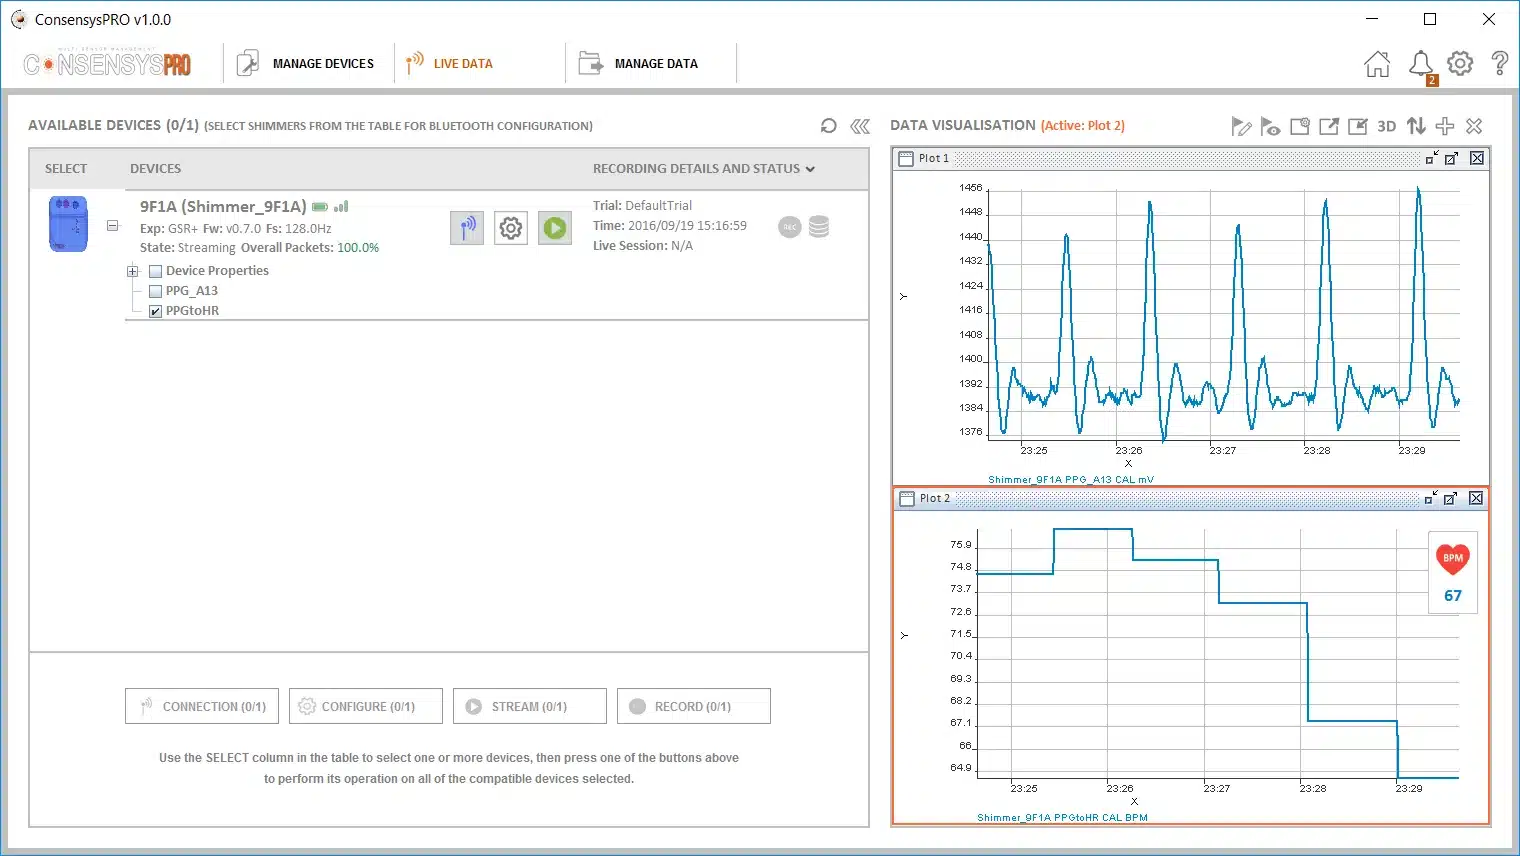
Figure 5‑1 ConsensysPRO streaming PPG over Bluetooth and implemented a PPG-to-HR algorithm
6. Hardware Considerations
6.1. Board Layout
Note: For Shimmer3 GSR+ hardware purchased prior to October 22nd, 2015*, refer to Appendix 10.1.*
The figures in this section show the board layout for the GSR+ Unit, with components labelled. The area on the board within with the orange dashed lines is the part of the circuitry of the GSR+ Unit that is described in this User Guide. The area on the board outside of the orange dashed lines is the circuitry of the Shimmer3, described in the Shimmer User Manual.
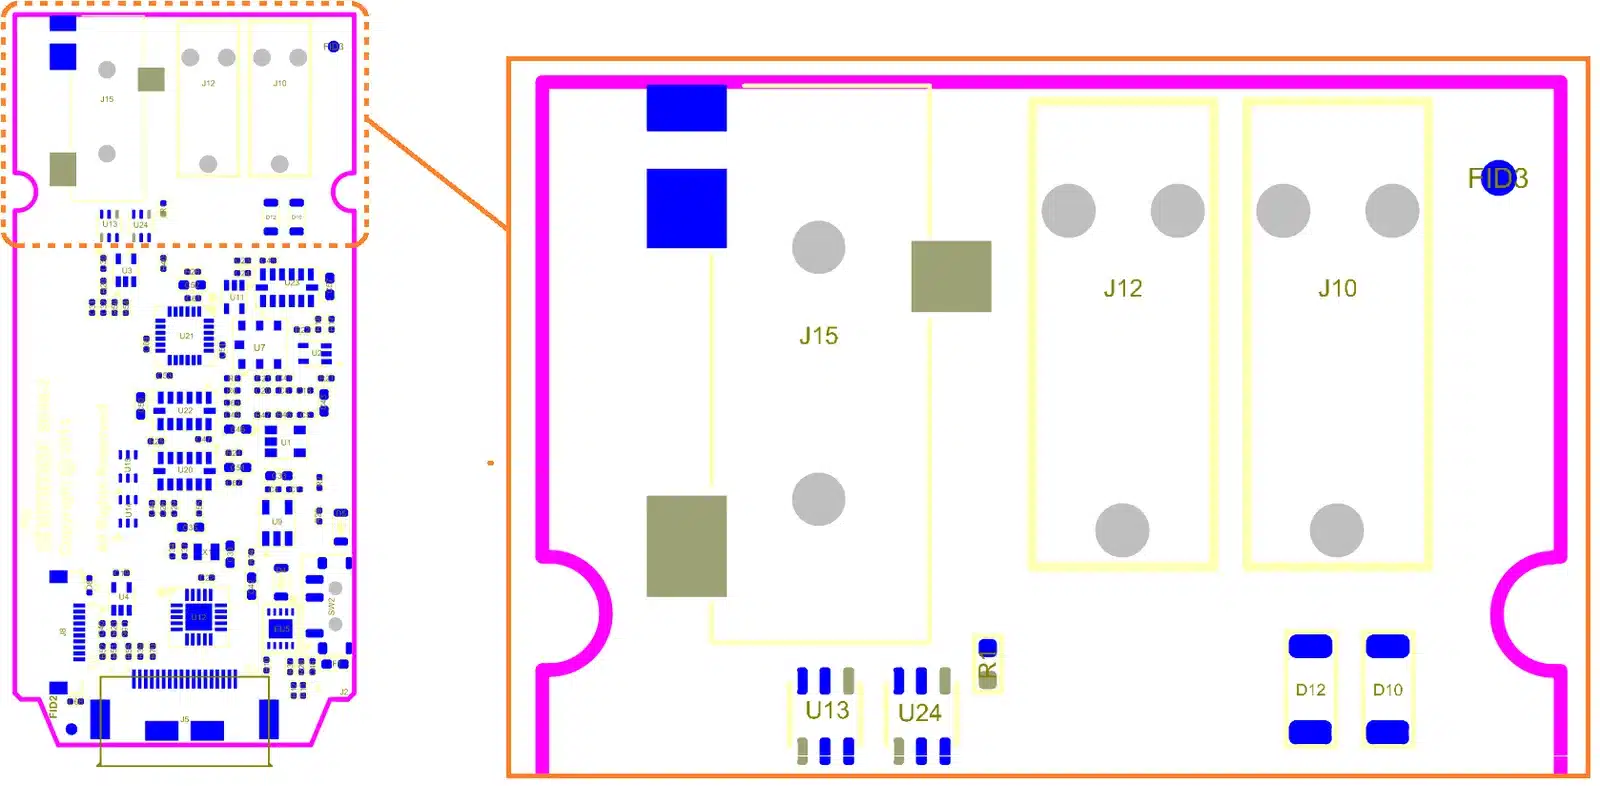
Figure 6‑1: GSR+ Board Layout (bottom view)
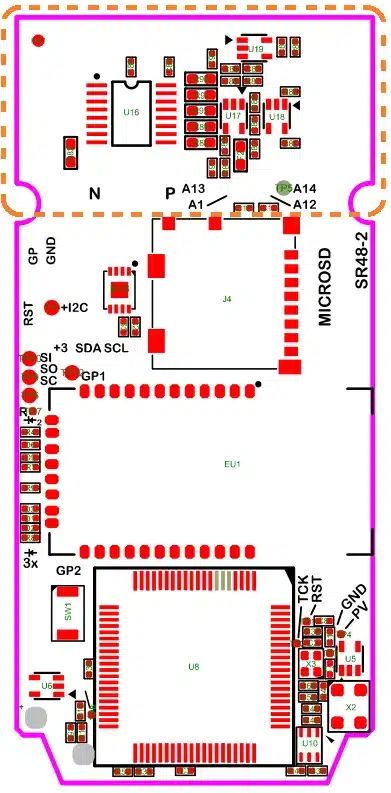
Figure 6‑2: GSR+ Board Layout (top view)
6.2. Hardware configuration options
Two of the inputs of the 3.5mm jack (J15) can be analog or digital, configurable through the switches U13 and U24 in Figure 6‑1. By default the inputs are configured for analog mode. See section 6.3 for details of the connections for J15 and other board connectors.
Firmware development by the user is required to add support for digital sensors and to switch the hardware configuration to digital mode, i.e. changing adc14(PIN7.6) = 1 (analog mode) to adc14(PIN7.6) = 0 (digital mode).
TODO(S3R): The board layout figures in 6.1, the switch references (U13, U24) and the processor pin (P7.6) are for the Shimmer3 GSR+ Unit. Add the Shimmer3R board layout and the equivalent switch and pin, or say that digital mode is not offered on Shimmer3R.
6.3. Connections
Table 6‑1 lists the internal and external connections on the GSR+ Unit. Table 6‑2 includes further detail regarding the connections on the 3.5mm jack (J15).
| Connector | Function | Notes |
|---|---|---|
| J10 | GSR – | Includes defibrillation protection (survive only, not repeat). |
| J12 | GSR + | Includes defibrillation protection (survive only, not repeat). |
| J15 | 3.5mm 4-position jack | See Table 6‑2 for further details. |
Table 6‑1 GSR+ Unit Connections
| Pin | Label | Function | Notes |
|---|---|---|---|
| 1 | Sleeve | GND | – |
| 2 | Tip | ADC13 or SD_SCL | Default configuration ADC13 |
| 3 | Ring 1 | ADC12 or SB_SDA | Default configuration ADC12 |
| 4 | Ring 2 | PV | If expansion power enabled, provides 3V |
Table 6‑2 Connections for 3.5mm 4-position jack (J15)
7. Firmware Considerations
7.1. Signals
GSR output signal is on ADC1 (P6.1). The full scale measurement range is selected using 2 digital address lines:
A0: GPIO_INTERNAL (P1.4)
A1: GPIO_INTERNAL2 (P2.1)
The expansion power enable, which powers on the EERPOM chip and the PV signal on the 4-position jack, is controlled by EXP_RESET_N (P3.3). When this signal is high EEPROM is enabled and PV is high (3V).
The MSP430 communicates with the EEPROM over the USCI_B0 I2C bus.
Shimmer3R: The processor pins above are those of the Shimmer3 (MSP430). On Shimmer3R, the GSR signal is read through the external ADC on the input named Int A3, which it shares: enabling GSR disables the Int A3 channel, just as on Shimmer3 it disables Int A1. The firmware is at https://github.com/ShimmerResearch/shimmer3r-firmware, and the GSR range switching is described in the shared GSR auto-range reference.
8. Troubleshooting
8.1. Verifying the GSR resistance values
In order to verify that the GSR channel of your GSR+ Unit is working correctly, you can use a potentiometer to input a known resistance to the board’s terminals. If the input resistance matches the calculated output resistance from the Shimmer then the GSR is working correctly.
To test the value of the potentiometer, a multimeter should be used. The calibrated output in Shimmer software, e.g., Consensys should match the multimeter’s reading. At least one reading should be taken for each possible full scale range, as defined in Section 3.1, by varying the potentiometer’s value.
8.2. DC-Voltage excitation
In our GSR measurement a DC voltage is used.
A common query received by the Shimmer support team concerns whether or not the electrodes may become polarized by the DC current. To answer that query, the following should be noted.
The AgCl electrodes that we use are considered to be non-polarizing and our circuit is designed to provide a low DC potential, reducing the effect of the counter-electromotive force.
Furthermore, for GSR measurement, the metric of interest is usually related to “activity” level or changes in the conductance, rather than focusing on the baseline values, which will slowly vary over time due to electrode-skin connection quality, temperature, et cetera. Thus, any slowly-varying component due to polarization is likely to be negligible for any practical application.
9. References
Bach, D. R., Flandin, G., Friston, K. J., & Dolan, R. J. (2009). Time-series analysis for rapid event-related skin conductance responses. Journal of Neuroscience Methods, 184, 224-234.
Benedek, M., & Kaernback, C. (2010). A continuous measure of phasic electrodermal activity. Journal of Neuroscience Methods, 190, 80-91.
Bourke, A. K., O’Donovan, K. J., & OLaighin, G. (2008). The identification of vertical velocity profiles using an inertial sensor to investigate pre-impact detection of falls. Medical Engineering & Physics, 30(7), 937-946.
Bourke, A. K., van de Ven, P., Gamble, M., O’Connor, R., Murphy, K., Bogan, E., . . . Nelson, J. (2010). Evaluation of waist-mounted tri-axial accelerometer based fall-detection algorithms during scripted and continuous unscripted activities. Journal of Biomechanics, 43(15), 3051-3057.
Bugané, F., Benedetti, M. G., Casadio, G., Attala, S., Biagi, F., Manca, M., & Leardini, A. (2012). Estimation of spatial-temporal gait parameters in level walking based on a single accelerometer: Validation on normal subjects by standard gait analysis. Computer Methods and Programs in Biomedicine, 108(1), 129-137.
Cacioppo, J. T., Tassinary, L. G., & Berntson, G. G. (2007). Handbook of Psychophysiology (3rd ed.). Cambridge University Press.
Craig, J. (1989). Introduction to Robotics: Mechanics and Control (2nd edition ed.). (J. Craig, Ed.) New York: Addison-Wesley.
Doheny, E. P., Foran, T. G., & Greene, B. R. (2010). A single gyroscope method for spatial gait analysis. Annual International Conference of the IEEE Engineering in Medicine and Biology Society EMBC 2010. Buenos Aires, Agentina.
Fowles, D. C., Christie, M. J., Edelberg, R., Grings, W. W., Lykken, D., & Venables, P. H. (1981). Committee report: Publication recommendations for electrodermal measurements. Psychophysiology, 18, 232-239.
Geddes, L. A., & Baker, L. E. (1989). Principles of Applied Biomedical Instrumentation (3rd ed.). New York, N.Y.: John Wiley.
Greco, A., Lanata, G., Valenza, G., Rota, G., Vanello, N., & Scilingo, E. (2012). On the Deconvolution Analysis of Electrodermal Activity in Bipolar Patients. Proceedings of the 34th Annual International Conference of the IEEE EMBS, EMBC. San Diego, California.
Greene, B. R., McGrath, D., O’Neill, R., O’Donovan, K. J., Burns, A., & Caulfield, B. (2010). An adaptive gyroscope-based algorithm for temporal gait analysis. Medical & Biological Engineering & Computing, 48(12), 1251 – 1260.
Harle, R. (2013). A Survey of Indoor Inertial Positioning Systems for Pedestrians. IEEE Communications Surveys & Tutorials, PP(99), 1 – 13.
Lim, C. L., Rennie, C., Barry, R. J., Bahramali, H., Lazzaro, I., Manor, B., & Gordon, E. (1997). Decomposing skin conductance into tonic and phasic components. International Journal of Psychophysiology, 25, 97-109.
Madgwick, S., Harrison, A. J., & Vaidyanathan, R. (2011). Estimation of IMU and MARG orientation using a gradient descent algorithm. IEEE International Conference on Rehabilitation Robotics (ICORR), (pp. 1-7).
Malmivuo, J., & R., P. (1995). Bioelectromagnetism – Principles and Applications of Bioelectric and Biomagnetic Fields. New York: Oxford University Press.
Mubashir, M., Shao, L., & Seed, L. (2013). A survey on fall detection: Principles and approaches. Neurocomputing, 100(Special Issue: Behaviours in Video), 144-152.
Nyan, M. N., Tay, F. E., & Murugasu, E. (2008). A wearable system for pre-impact fall detection. Jounral of Biomechancis, 41(16), 3475-3481.
Sabatini, A., Martelloni, C., Scapellato, S., & Cavallo, F. (2005). Assessment of walking features from foot inertial sensing. IEEE Transactions on Biomedical Engineering, 52(3), 486 – 494.
Skog, I., Nilsson, J. O., & Handel, P. (2010). Evaluation of zero-velocity detectors for foot-mounted inertial navigation systems. International Conference on Indoor Positioning and Navigation IPIN2010. Zurich, Switzerland.
Winter, D. (1990). Biomechanics and Motor Control of Human Movement, Second Edition. New York: Wiley.
Won, S. H., Melek, W. W., & Golnaraghi, F. (2010). A Kalman/Particle Filter-Based Position and Orientation Estimation Method Using a Position Sensor/Inertial Measurement Unit Hybrid System. IEEE Transactions on Industrial Electronics, 57(5), 1787-1798.
Yadav, N., & Bleakley, C. (2011). Two stage Kalman filtering for position estimation using dual Inertial Measurement Units. 2011 IEEE SENSORS. Limerick, Ireland.
Zijlstra, W. (2004). Assessment of spatio-temporal parameters during unconstrained walking. European Jorunal of Applied Physiology, 92(1-2), 36-44.
10. Appendices
10.1. Legacy Hardware
The information in this section is relevant for Shimmer3 GSR+ hardware purchased prior to November 2015. Figure 10‑1 shows the board layout for the GSR+ Module, with components labelled. Two of the inputs of the 3.5mm jack (J3) can be analog or digital, depending on the board configuration. See Table 10‑1 and Table 10‑2 for details of the connections for J3 and other board connectors.
All board have been shipped with analog configuration by default; this configuration can be recognised by checking that R1 and R2 are not populated (see Figure 10‑1, between J6 and J7). To switch to digital configuration, a zero Ohm resistor should be installed for each of R1 and R2.
Board Layout
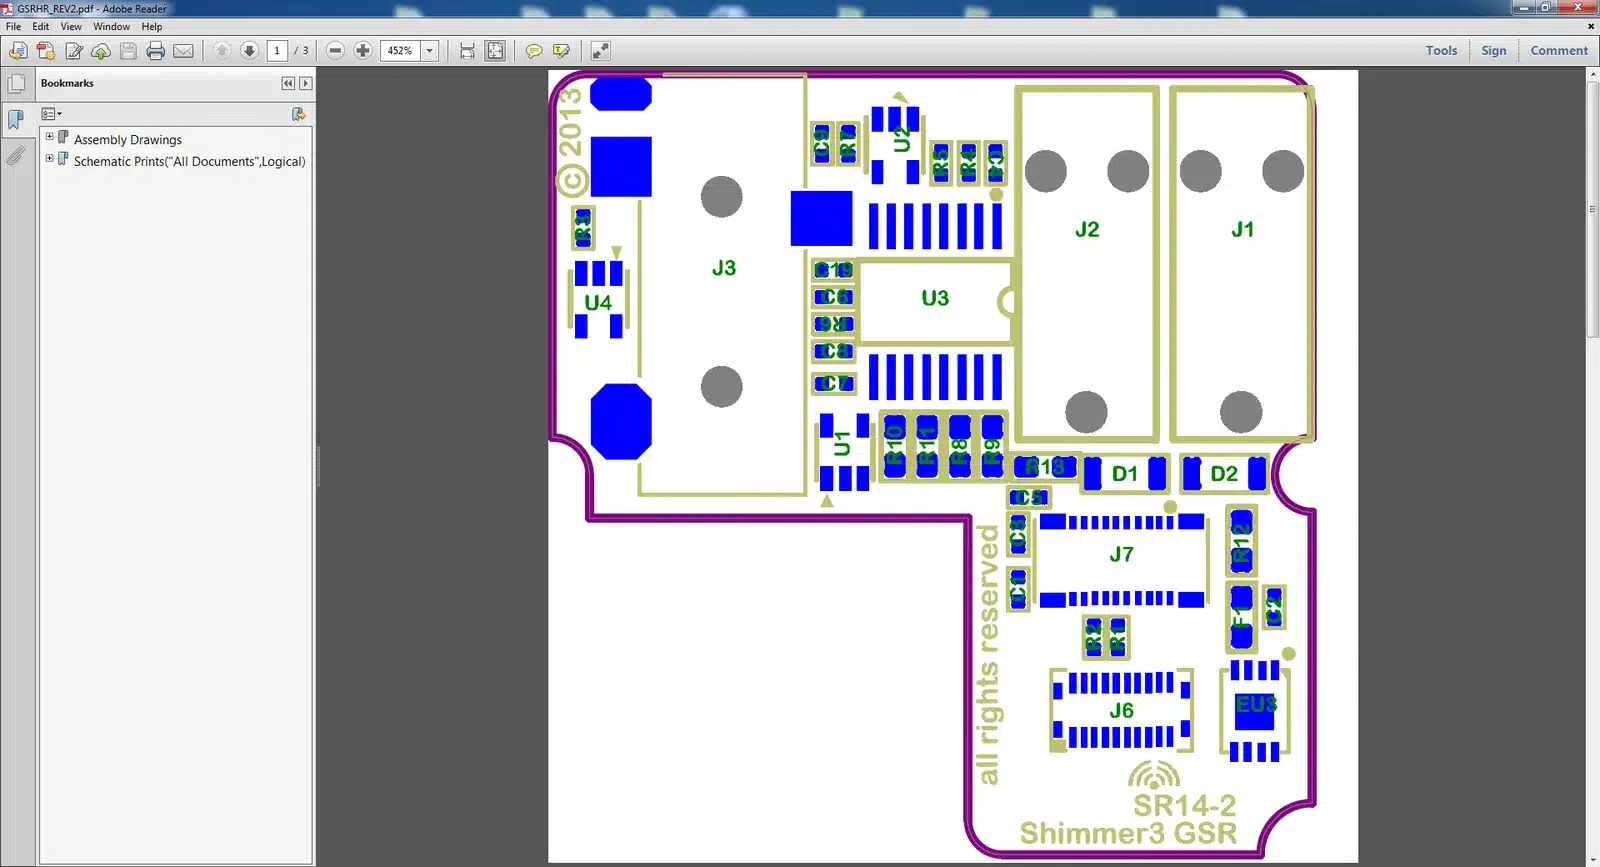
Figure 10‑1 GSR+ Expansion Board Layout
Connections
Table 10‑1, below, lists the internal and external connections on the GSR+ Expansion Board. Table 10‑2 includes further detail regarding the connections on the 3.5mm jack (J3).
| Connector | Function | Notes |
|---|---|---|
| J1 | GSR – | Includes defibrillation protection (survive only, not repeat). |
| J2 | GSR + | Includes defibrillation protection (survive only, not repeat). |
| J3 | 3.5mm 4-position jack | See Table 10‑2 for further details. |
| J6/J7 | Internal expansion connector | See Shimmer3 User Manual for further details. |
Table 10‑1 GSR+ Expansion Board Connections
| Pin | Label | Function | Notes |
|---|---|---|---|
| 1 | Sleeve | GND | – |
| 2 | Tip | ADC13 or SD_SCL | Default configuration ADC13 |
| 3 | Ring 1 | ADC12 or SB_SDA | Default configuration ADC12 |
| 4 | Ring 2 | PV | If expansion power enabled, provides 3V |
Table 10‑2 Connections for 3.5mm 4-position jack (J3)
Troubleshooting
Troubleshooting information that only applies to legacy hardware: If the GSR data being streamed from the Shimmer do not seem to be responsive to changes in resistance, it is likely that the connection between the expansion board and the mainboard has not been securely made.
To verify the connection, a simple test is to connect to the Shimmer via the COM port from one of the Shimmer applications like Consensys or any of the Shimmer instrument drivers. Then, configure the device to enable the GSR sensor, and start streaming. While streaming, create a short/closed circuit between the GSR electrodes by pressing them together; then, create an open circuit by separating the electrodes. While creating closed and open circuits repeatedly, the streamed raw GSR data should look like that in Figure 10‑2 (recall that the raw data is proportional to conductance).
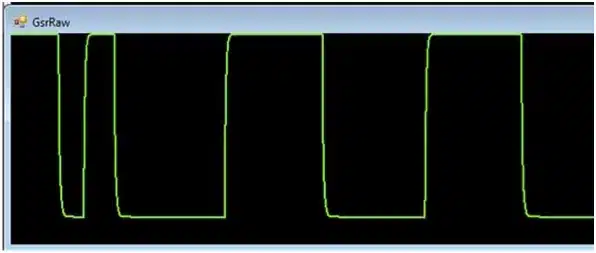
Figure 10‑2 Open circuit and short circuit GSR output in ShimmerConnect
If you do not see the step changes show in Figure 10‑2, then the connection is likely not secure.
For any device purchased on or after September 1st, 2014, the GSR+ Module is permanently fixed to the Shimmer3 mainboard. Removal of the expansion board from the mainboard should not be carried out under any circumstances. Doing so will cause damage to one or both of the boards and any necessary repairs will not be covered by warranty.
For devices purchased before September 1st, 2014, it was possible to disconnect the GSR + Module from the Shimmer3 mainboard. For these devices, Shimmer recommends an adhesive to secure the connection between the Shimmer3 mainboard and Expansion Boards. The adhesive that is used by Shimmer during assembly is called Superdots (www.superdots.com). We use the Ultra Tak variety. With Superdots applied, the expansion boards can still be removed and swapped out, if required, as the adhesive does not go solid but has a rubbery consistency, allowing it to be removed. However, customers should remember that frequently removing expansion boards is not recommended and can cause damage to the connectors. Superdots also provides some shock absorbtion.
Shimmer fits the Superdots by stretching them around the edges of the Expansion Board. This ensures that the adhesive doesn’t prevent the connectors from making a good connection and there is enough adhesive to secure the boards together but not to interfere with the fit.
Note: Shimmer does not supply Superdots.
10.2. Opening the Shimmer3 expansion enclosure
Whilst the Shimmer3 enclosures can be opened to allow users to change the SD card, it is important to note that the plastic enclosures are not designed for regular opening and closing. In particular, it is recommended that the screws not be removed and reinserted on a regular basis as damage to the plastic by over-use of the screw mechanism will occur. Furthermore, the expansion board connectors can be damaged by disconnecting and reconnecting, resulting in the loss of communication with the expansion board.
For (legacy) devices purchased between September 2014 and October 22nd, 2015, the GSR+ Module will be permanently fixed to the Shimmer3 mainboard. Removal of the expansion board from the mainboard should not be carried out under any circumstances. Doing so will cause damage to one or both of the boards and any necessary repairs will not be covered by warranty.
For (legacy) devices purchased before September 1st, 2014, it is possible to disconnect the GSR+ Module from the Shimmer3 mainboard. Please note, however, that this is not recommended.
Whether the GSR+ Module is permanently fixed to the Shimmer3 mainboard or not, if the enclosure must be opened to replace the SD card, care must be taken not to damage the expansion board connection, which could result in loss of communication between the expansion board and the Shimmer3 mainboard. Please refer to the Shimmer assembly video on our YouTube channel9.

Legal notices
GSR+ User Guide
Revision 1.13
Legal Notices and Disclaimer
Redistribution IS permitted provided that the following conditions are met:
Redistributions must retain the copyright notice, and the following disclaimer. Redistributions in electronic form must reproduce the above copyright notice, this list of conditions and the following disclaimer in the documentation and/or other materials provided with the document.
Neither the name of Shimmer Research, or Realtime Technologies Ltd. nor the names of its contributors may be used to endorse or promote products derived from this document without specific prior written permission.
THIS DOCUMENT IS PROVIDED BY THE COPYRIGHT HOLDERS AND CONTRIBUTORS “AS IS” AND ANY EXPRESS OR IMPLIED WARRANTIES, INCLUDING, BUT NOT LIMITED TO, THE IMPLIED WARRANTIES OF MERCHANTABILITY AND FITNESS FOR A PARTICULAR PURPOSE ARE DISCLAIMED. IN NO EVENT SHALL THE COPYRIGHT OWNER OR CONTRIBUTORS BE LIABLE FOR ANY DIRECT, INDIRECT, INCIDENTAL, SPECIAL, EXEMPLARY, OR CONSEQUENTIAL DAMAGES (INCLUDING, BUT NOT LIMITED TO, PROCUREMENT OF SUBSTITUTE GOODS OR SERVICES; LOSS OF USE, DATA, OR PROFITS; OR BUSINESS INTERRUPTION) HOWEVER CAUSED AND ON ANY THEORY OF LIABILITY, WHETHER IN CONTRACT, STRICT LIABILITY, OR TORT (INCLUDING NEGLIGENCE OR OTHERWISE) ARISING IN ANY WAY OUT OF THE USE OF THIS DOCUMENT, EVEN IF ADVISED OF THE POSSIBILITY OF SUCH DAMAGE.
