
Preview: this manual is being updated to cover Shimmer3R. Notes marked TODO are open questions our team is still confirming.
1. Introduction
This document is an accompaniment to the Shimmer3 ECG Unit (called ECG Unit in the rest of this document). Its purpose is to aid the user in getting started with ECG measurements.
The ECG Unit can be configured to measure electrical signals from the skin, including ECG (Electrocardiograph). Any user who wishes to use Shimmer hardware to record EMG (Electromyograph) signals from the skin should refer to the Shimmer3 EMG User Guide, which is available for download from http://www.shimmersensing.com.
The five-wire, four-lead ECG Unit can be configured to record the pathway of electrical impulses through the heart muscle. This data can be recorded on resting and ambulatory subjects, or during exercise to provide information about the heart’s response to physical exertion. Signals are collected from the skin via five wires, which are connected externally to the ECG Unit, and to which should be attached conventional disposable electrodes. The ECG Unit uses a low-power, multichannel analog front-end especially designed for biopotential measurements, consisting of delta-sigma analog-to-digital converters and programmable gain amplifiers.
2. General Information
2.1. Safety Information
As a precaution it is important to note that the ECG leads are not to be applied to the subject’s body while unit is in a USB dock or multi-charger.
2.2. Pre-Requisites
- A Shimmer3 ECG Unit programmed with appropriate firmware. For example, LogAndStream (v0.7.0 or greater) can be used to stream data over Bluetooth and/or log data to the SD card or SDLog (v0.13.0 or greater) can be used to log data to the SD card; both are available for download from www.shimmersensing.com.
Five DIN snap leads.
9-inch and 18-inch leads are shipped with the ECG Development Kit and ECG Bundles.
Replacements can be purchased from www.shimmersensing.com.
Surface ECG electrodes.
Disposable electrodes are shipped with the ECG Development Kit and ECG Bundles.
For replacements, see www.shimmersensing.com. Alternatively, the Covidien Kendall Disposable Surface EMG/ECG/EKG electrodes 1″ (24mm) or Covidien Kendall Disposable Surface EMG/ECG/EKG electrodes 1 3/8″ (35mm), available on www.bio-medical.com with product codes ‘BRD H124SG’ and ‘BRD H135SG’, respectively, and the Ambu Blue Sensor T electrodes, available from various suppliers, are all suitable options and have been validated for use with Shimmer equipment.
2.3. ECG Unit Specification Overview
- For specifications on the general Shimmer3 part (i.e. microprocessor, radio, data storage and inertial sensors) of the Shimmer3 ECG Unit, please refer to the Shimmer User Manual.
Shimmer3R: The Shimmer3R ECG Unit uses the same front end, two TI ADS1292R chips, with the gain, data rate, bandwidth and driven ground listed here. For the general part of a Shimmer3R (processor, radio, storage and kinematic sensors), see Shimmer3R hardware in the Shimmer User Manual.
TODO(S3R): Confirm the input range, input protection, current consumption, weight and size figures in this list for the Shimmer3R ECG Unit (its spec sheet gives 31 g and 65 × 32 × 12 mm).
Gain: Configurable (1, 2, 3, 4, 6, 8, 12)
Data rate: software configurable (125, 250, 500, 1000, 2000, 4000, 8000 SPS)
Input differential dynamic range1: approx 800 mV (for gain = 6).
Bandwidth2: 8.4 kHz
Ground: Wilson Type Driven Ground
Input Protection: ESD and RF/EMI filtering; Current limiting; inputs include defibrillation protection (survive only, not repeat). NOTE: For inputs LA and RA the defibrillation protection is not present in order to facilitate Respiration demodulation.
Connections: Input RA, Input LA, Input LL, Input Vx, Reference (RL)
- All Hospital-Grade 1mm Touchproof IEC/EN 60601-1 DIN42802 jacks.
Ultra-lightweight (31 grams); Compact Dimensions (65 x 32 x 12 mm).
EEPROM memory: 2048 bytes.
3. Using the ECG Unit
3.1. Basic System Overview
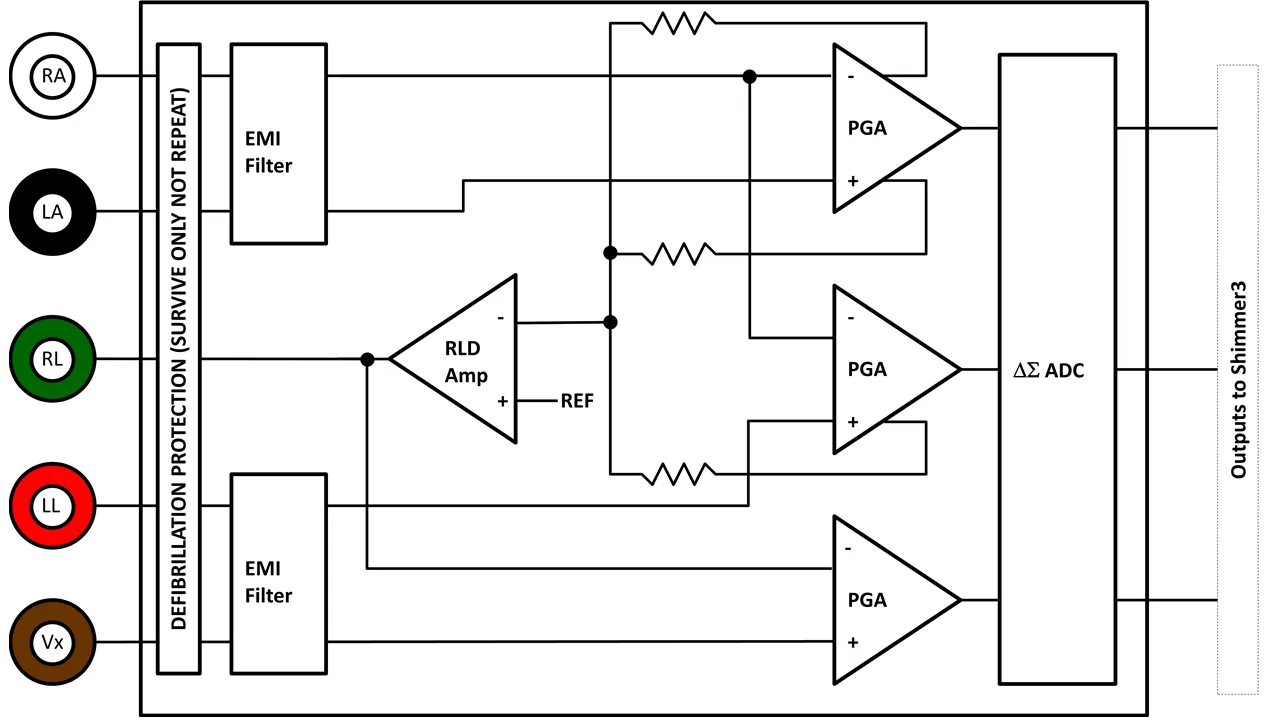
Figure 3‑1: Simplified Block Diagram
Electrodes: Each ECG board connects to RA (white), LA (black), RL (green), LL (red) and Vx (brown) electrodes.
Defibrillation protection: Survive only; not repeat. No defibrillation protection is present for inputs RA and LA to facilitate Respiration demodulation.
EMI Filter: Reduces electromagnetic interference; -3dB filter bandwidth is approximately 3MHz.
Right-Leg Drive Amplifier (RLD Amp): Counteracts common-mode interference (e.g. from mains power lines, fluorescent lights and other sources).
Programmable Gain Amplifier (PGA): Increases amplitude of input signal; seven gain settings available. See Section 4.5 to accurately calculate the gain of your device. Default gain is configurable in software.
∆Σ Analog to Digital Converters (∆Σ ADC): Converts the input analogue signals to a digital representation of this signal by a 24-bit signed integer value to each sample. These values are fed to the Shimmer3 processor to be saved to the SD card or transmitted over Bluetooth.
3.2. ECG Leads
In the context of electrocardiography, the word “lead” is used to refer to the signal of the voltage difference between two electrodes (i.e. the signal produced by the ECG recorder). In order to avoid any confusion, the wires that are used to physically connect the electrodes to the ECG Unit are referred to throughout this document as just that – “wires”.
The ECG Unit provides a four-lead ECG solution, with the following leads being measured in the recommended configuration:
Bipolar limb leads:
Lead I (LA-RA) is the ECG vector signal measured from the RA (right arm) position to the LA (left arm) position. This is output on the ExG1 Ch2 channel of the ECG Unit.
Lead II (LL-RA) is the ECG vector signal measured from the RA (right arm) position to the LL (left leg) position. This is output on the ExG1 Ch1 channel of the ECG Unit.
Lead III (LL-LA) is the ECG vector signal measured from the LA (left arm) position to the LL (left leg) position. This is derived by subtracting Lead I from Lead II.
Unipolar leads:
Electrode Positioning
The inputs to the ECG Unit are labelled according to the suggested placement, in order to measure the four channels listed above:
Bipolar limb lead electrodes:
LA Left Arm
RA Right Arm
LL Left Leg
RL Right Leg
Unipolar lead electrode positions:
- Vx V1, V2, V3, V4, V5 or V6, on the chest
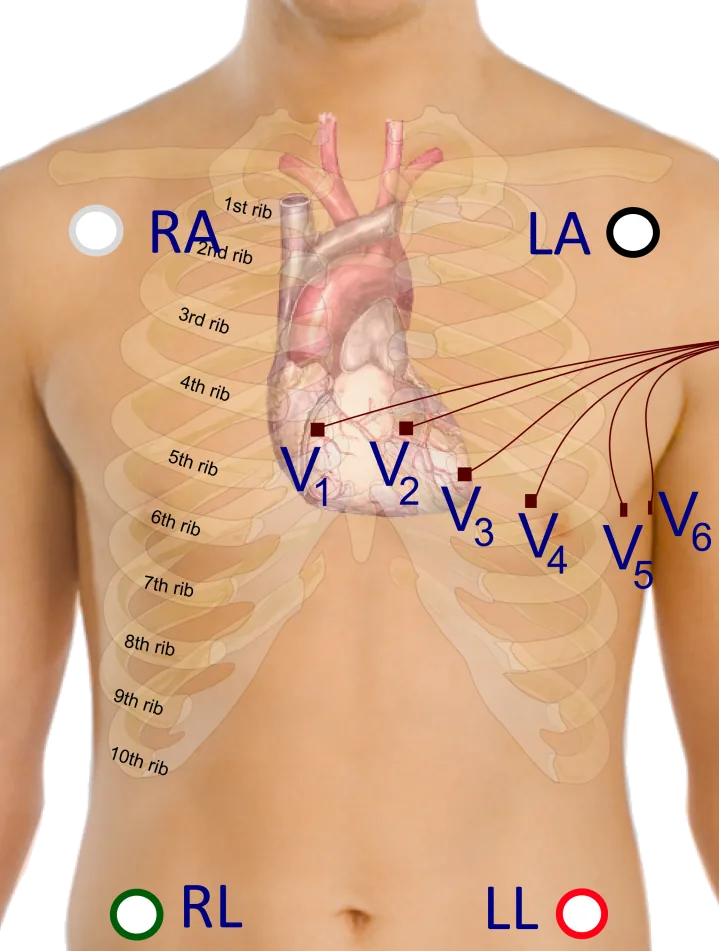
Figure 3‑2 Example positioning of the electrodes for ECG measurement with 18″ leads
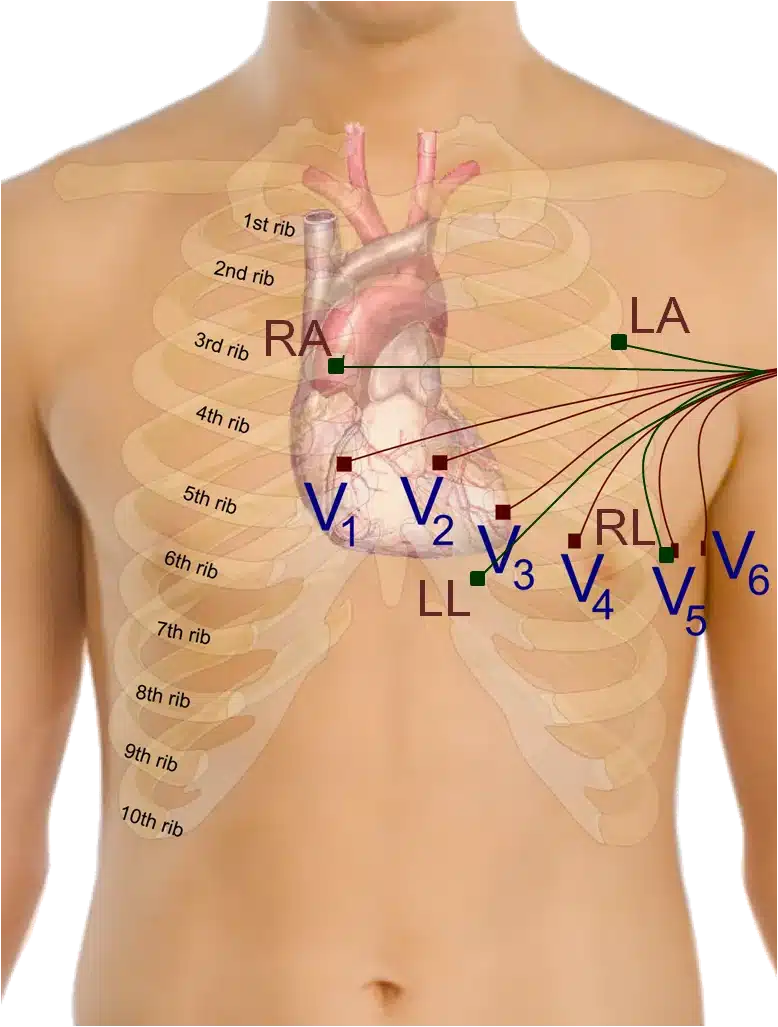
Figure 3‑3: Example positioning of the electrodes for ECG measurement with 9” leads
Figure 3‑2 shows an example of how the electrodes should be positioned on the body. The electrodes for the bipolar limb leads (LA, RA, LL and RL) are represented by green nodes and wires, whilst the V1, V2, V3, V4, V5 and V6 positions for the unipolar leads, are represented by brown nodes and wires.
Although it is common practise to place the limb electrodes on the arms/legs, according to their names, in reality, all of the limb electrodes can be placed on the chest. The important thing is that each electrode should be placed on the body, away from the heart and in the direction of the joint to the relevant limb. For example, the RA electrode can be placed anywhere on the chest as long as it is positioned away from the heart in the direction of the right shoulder, as shown in Figure 3‑3.
The reference electrode (RL) can be placed anywhere on the body as long as it is outside of the triangle formed by the 3 other limb electrodes (i.e. RA, LA and LL). In the diagram below it is placed at the V5 position, laterally on the left side of the torso. This position allows for the highest quality capturing of R waves. [1]
The Vx electrode can be placed at any of the positions, V1, V2, V3, V4, V5 or V6, depending on the user’s requirements.
Wilson’s Central Terminal
The Wilson’s Central Terminal (WCT) is a voltage that represents the average potential of the body and acts as a reference point, with respect to which the voltage difference for the unipolar leads is measured. It is calculated by averaging the voltage measured at the RA, LA and LL electrodes.
The inverted WCT voltage is driven to the body via the RL electrode to create a negative feedback loop in the measurement system and provide common mode interference rejection.
3.3. Configuration Options and Recommended Settings
The ECG Unit contains two ADS1292R chips from Texas Instruments; these have a very wide and varied range of available configuration options. These chips are referred to as “Chip1” and “Chip2” throughout this document. This section aims to provide recommended settings, which will suit the needs of most ECG measurement applications. The experienced user who wishes to have full control over all of the configuration settings should refer to the ADS1292R datasheet from Texas Instruments for more details.
There are two ADS1292R chips on the ECG Unit and each of these chips has eleven bytes of configurable register settings. Ten of these configurable bytes are listed in Table 3‑1 and their recommended values are discussed in this section. The final byte, which pertains to GPIO settings, is dealt with in firmware and not discussed here.
Byte |
Name |
Bit 7 |
Bit 6 |
Bit 5 |
Bit 4 |
Bit 3 |
Bit 2 |
Bit 1 |
Bit 0 |
|---|---|---|---|---|---|---|---|---|---|
0 |
CONFIG1: Configuration Register 1 |
0 |
0 |
0 |
0 |
0 |
Data Rate |
||
1 |
CONFIG2: Configuration Register 2 |
1 |
0 |
1 |
0 |
X 1 |
0 |
INT_TEST |
TEST_FREQ |
2 |
LOFF: Lead-Off Control Register |
0 |
0 |
0 |
1 |
0 |
0 |
0 |
0 |
3 |
CH1SET: Channel 1 Settings |
0 |
Gain1 |
MUX1 |
|||||
4 |
CH2SET: Channel 2 Settings |
0 |
Gain2 |
MUX2 (M2_3, M2_2, M2_1, M2_0) |
|||||
5 |
RLD_SENS: Right Leg Drive Sense Selection |
0 |
0 |
PDB_RLD |
RLD_LOFF_SENS |
RLD Settings (RLD2N, RLD2P, RLD1N, RLD1P) |
|||
6 |
LOFF_SENS: Lead-Off Sense Selection |
0 |
0 |
0 |
0 |
0 |
0 |
0 |
0 |
7 |
LOFF_STAT: Lead-Off Status Selection |
0 |
0 |
0 |
0 |
0 |
0 |
0 |
0 |
8 |
RESP1: Respiration Control Register 1 |
0 |
0 |
0 |
0 |
0 |
0 |
1 |
0 |
9 |
RESP2: Respiration Control Register 2 |
0 |
0 |
0 |
0 |
0 |
0 |
RLDREF_INT |
1 |
The Bit 3 in CONFIG2 denotes “X=0” for SR47-1 revision, and “X=1” for SR47-4 and greater revisions. This feature has been configured automatically in both LogAndStream 0.11.0 and SDLog_v0.19.0 (and newer).↩︎
Table 3‑1 lists the recommended values of the ADS1292R configuration register bytes. The values of the individual bits are listed in the columns labelled Bit 7 (MSB), Bit 6, and so on to Bit 0 (LSB). The recommended values of some sets of bits, like multiplexer (MUX) settings, channel gain settings and others, differ depending on the type of signal being measured (e.g. ECG or EMG), and others, like output data rate and test signal, depend on the user’s preferences.
Data Rate
The Data Rate for each chip can be set by modifying the three LSBs of the CONFIG1 register (Byte 0). Table 3‑2 lists the valid options and their corresponding data rate value in units of samples per second (SPS). For ECG, a data rate of 500 SPS or more is recommended, although the needs of a given application may vary.
| Data Rate (SPS) | DR2 | DR1 | DR0 |
|---|---|---|---|
| 125 | 0 | 0 | 0 |
| 250 | 0 | 0 | 1 |
| 500 (recommended) | 0 | 1 | 0 |
| 1000 | 0 | 1 | 1 |
| 2000 | 1 | 0 | 0 |
| 4000 | 1 | 0 | 1 |
| 8000 | 1 | 1 | 0 |
| DO NOT USE | 1 | 1 | 1 |
Table 3‑2 ECG Data Rate options
Gain
The Gain setting can be configured independently for each of the two data channels on each chip by modifying bits 4 – 6 of the CH1SET byte for channel 1 and of the CH2SET byte for channel 2, respectively. The gain bits for channel 1 of a given chip are listed as G1_2 (MSB), G1_1 and G1_0 (LSB) in Table 3‑1, whilst the equivalent for channel2 of the chip are listed as G2_2, G2_1 and G2_0, respectively. These are collectively referred to as Gx_2, Gx_1 and Gx_0, respectively, in Table 3‑3, which lists the valid options and the corresponding gain value for each. For ECG, a gain value of 4 is recommended.
| Gain | Gx_2 | Gx_1 | Gx_0 |
|---|---|---|---|
| 6 (default) | 0 | 0 | 0 |
| 1 | 0 | 0 | 1 |
| 2 | 0 | 1 | 0 |
| 3 | 0 | 1 | 1 |
| 4 (recommended) | 1 | 0 | 0 |
| 8 | 1 | 0 | 1 |
| 12 | 1 | 1 | 0 |
| DO NOT USE | 1 | 1 | 1 |
Table 3‑3 ECG Channel Gain options
Input Multiplexer
The multiplexer (MUX) settings can be configured independently for each of the two data channels on each chip; the MUX bits for channel 1 of a given chip are listed as MUX1_3 (MSB), MUX1_2, MUX1_1 and MUX1_0 (LSB) in Table 3‑1, whilst the equivalent for channel2 of the chip are listed as MUX2_3, MUX2_2, MUX2_1 and MUX2_0, respectively. Table 3‑4 lists the recommended MUX configuration for each chip and channel for ECG data collection.
| Chip | MUX1_3 | MUX1_2 | MUX1_1 | MUX1_0 | MUX2_3 | MUX2_2 | MUX2_1 | MUX2_0 |
|---|---|---|---|---|---|---|---|---|
| Chip1 | 0 | 0 | 0 | 0 | 0 | 0 | 0 | 0 |
| Chip2 | 0 | 0 | 0 | 0 | 0 | 1 | 1 | 1 |
Table 3‑4 Recommended MUX settings for ECG
Right-Leg Drive
The right-leg drive (RLD) settings determine the voltage that should be used at the input of the right-leg drive amplifier for common-mode interference rejection and can be configured independently for each chip. The RLD Settings bits for a given chip are listed as RLD2N, RLD2P, RLD1N and RLD1P in Table 3‑1. For ECG configuration, the recommended setting is to choose the Wilson’s Central Terminal voltage ((RA + LA + LL)/3) as the negative input to the RLD amplifier on Chip1 and no RLD signal on Chip2. This can be achieved by setting the configuration listed in Table 3‑5.
| Chip | RLD2N | RLD2P | RLD1N | RLD1P |
|---|---|---|---|---|
| Chip14 | 1 | 1 | 0 | 1 |
| Chip2 | 0 | 0 | 0 | 0 |
Table 3‑5 Recommended RLD channel selection settings for ECG – Wilson terminal voltage.
Table 3‑6 gives an alternative configuration in which, rather than using the Wilson terminal voltage, the voltage on the RLD electrode is held at a fixed potential – in this case half of the Shimmer3 supply voltage (approximately 1.5 V).
| Chip | RLD2N | RLD2P | RLD1N | RLD1P |
|---|---|---|---|---|
| Chip1 | 0 | 0 | 0 | 0 |
| Chip2 | 0 | 0 | 0 | 0 |
Table 3‑6 Alternative RLD channel selection settings for ECG – fixed potential.
The PDB_RLD bit of the RLD_SENS byte (byte 5, bit 5) determines if the RLD buffer is powered on (1) or not (0).
The RLDREF_INT bit of the RESP2 byte (byte 9, bit 1) controls the RLDREF signal source for the RLD amplifier. If the value of the bit is 0, the reference signal is fed externally. If the value of the bit is 1, an internally generated reference signal is generated.
For ECG data collection, the settings in Table 3‑7 are recommended for PDB_RLD, RLD_LOFF_SENS and RLDREF_INT.
| Chip | PDB_RLD | RLD_LOFF_SENS | RLDREF_INT |
|---|---|---|---|
| Chip1 | 1 | 0 | 1 |
| Chip2 | 0 | 0 | 0 |
Table 3‑7 Recommended RLD settings for ECG
Test Signal
In order to test the ECG output channels, a test signal can be internally generated by each chip. This signal can either be a DC voltage or a 1Hz square wave. The enable the test signal, the two LSBs of the CONFIG2 byte (byte 1, bits 1-0) for each chip should be set as in Table 3‑8. Furthermore, the MUX1 or MUX2 bits should be set to 0000 so that the test signal will appear on channel 1 or channel 2, respectively.
| Test signal | INT_TEST | TEST_FREQ |
|---|---|---|
| DC test signal | 1 | 0 |
| 1 Hz square wave test signal | 1 | 1 |
| No test signal | 0 | 0 |
Table 3‑8 Test signal settings for ECG
Respiration demodulation
The ADS1292R from Texas Instruments includes logic for respiration demodulation from ECG signals. Support for this advanced functionality can be obtained by contacting the Shimmer support team via www.shimmersensing.com. In the meantime, interested users may refer to the ADS1292R datasheet for more details.
Lead-off detection configuration
The ADS1292R from Texas Instruments provides the ability to detect if an electrode has be disconnected from the body. This is implemented inside the chip by enabling a constant DC current source and sink on each pair of bipolar inputs. Once enabled, when one of the electrodes is disconnected from the body, the voltage at that electrode will be pulled high or low – this will be apparent on the measured voltage signal.
Note: due to the nature of the measurement method, by enabling lead-off detection the measurement system will be more susceptible to thermal noise and a small DC voltage offset is introduced into the ECG signal measurements.
To enable lead-off detection, the following changes to the recommended ECG configuration bytes should be made.
Chip – Byte |
Mask (hex) |
Mode |
||
|---|---|---|---|---|
DC Current Byte Value (hex) |
Off Byte Value (hex) |
|||
Source |
Chip 1 – Byte 2 Chip 2 – Byte 2 |
0x01 |
0x00 (DC Current) |
N/A |
General comparators (Enable/disable) |
Chip 1 – Byte 1 Chip 2 – Byte 1 |
0x40 |
0x40 (On) |
0x00 (Off) |
Comparators on each input |
Chip 1 – Byte 6 |
0x0F |
0x07 (2P, 1N, 1P) |
0x00 (Off) |
Chip 2 – Byte 6 |
0x0F |
0x04 (2P) |
0x00 (Off) |
|
RLD sense |
Chip 1 – Byte 5 |
0x10 |
0x10 (On) |
0x00 (Off) |
The level of DC current used for lead-off detection can be set by changing configuration bytes as shown in Table 3‑10. From lab testing we have found 22nA to be a suitable level for lead-off detection.
| Chip 1 – Byte 2 and Chip 2 Byte 2 | |||
|---|---|---|---|
| Current | Mask (hex) | Byte Value (hex) | Byte Value (dec) |
| 6nA | 0x0C | 0x00 | 0 |
| 22nA | 0x0C | 0x04 | 4 |
| 6uA | 0x0C | 0x08 | 8 |
| 22uA | 0x0C | 0x0C | 12 |
The ADS1292R has built-in voltage comparators that are connected to each of the electrode inputs and can be enabled or disabled in the configuration bytes – see Table 3‑9. The voltage threshold at which these comparators are triggered – given as a percentage of the supply voltage – can be configured as shown in Table 3‑10 below. From lab testing we have found a comparator threshold of “Pos:90% – Neg:10%” to be a suitable level for lead-off detection.
| Chip 1 – Byte 2 and Chip 1 Byte 2 | |||
|---|---|---|---|
| Comparator threshold | Mask (hex) | Byte Value (hex) | Byte Value (dec) |
| Pos:95% – Neg:5% | 0xE0 | 0x00 | 0 |
| Pos:92.5% – Neg:7.5% | 0xE0 | 0x20 | 32 |
| Pos:90% – Neg:10% | 0xE0 | 0x40 | 64 |
| Pos:87.5% – Neg:12.5% | 0xE0 | 0x60 | 96 |
| Pos:85% – Neg:15% | 0xE0 | 0x80 | 128 |
| Pos:80% – Neg:20% | 0xE0 | 0xA0 | 160 |
| Pos:75% – Neg:25% | 0xE0 | 0xC0 | 192 |
| Pos:70% – Neg:30% | 0xE0 | 0xE0 | 224 |
The outputs of the voltage comparators are stored in the status byte channel from each chip where a ‘0’ represents a connected electrode and a ‘1’ indicates a disconnected electrode.
| ECG electrode | Chip input | Lead-Off Status Byte |
|---|---|---|
| LA | Chip 1 – 2P | Chip 1 – Bit2 |
| RA | Chip 1 – 1N | Chip 1 – Bit3 |
| LL | Chip 1 – 1P | Chip 1 – Bit0 |
| Vx | Chip 2 – 2P | Chip 2 – Bit2 |
| RLD | Chip 1 – RL | Chip 1 – Bit4 |
Table 3‑12 The relevant bits in each of the status bytes that represent the lead-off status of each of the electrodes for ECG mode.
4. Measuring ECG Signals
4.1. Best Practice on How to Acquire a High Quality ECG signal
Skin Preparation
Skin preparation is not essential for ECG measurements; however, ensuring a good electrode to skin contact improves signal quality and minimises the likelihood of signal interference from electrodes falling off or sporadic contact caused by hairs or dirt particles. As such, if an improved signal quality is required, any hairs at the contact point can be shaved off and the skin should be cleaned with alcohol or sanitizer to remove oils and sweat which can interfere with the signal [2].
Sampling Frequency
Although the choice of sampling frequency is entirely up to the user, a sampling rate of 512Hz is recommended for clinical grade ECG data acquisition. Lower rates can be used for ambulatory ECG measurements [3].
Wires
Because ECG signals have a very low voltage, it is recommended that the minimum feasible wire length is used to minimise signal interference. Simply put, the shorter the wire, the less interference will be experienced in the signal. Interference can come from motion artifact, mains interference (50/60Hz) and other wireless signals and becomes much more significant with longer wires. Should you require longer wires for your application, it is likely you will require mains notch filtering (as described below).
Wires can also be secured to reduce noise from motion artefact and eliminate the possibility of them pulling on electrodes which can cause them to fall off and reduce electrode to skin contact quality.
Filtering
Mains Notch Filtering
If your signal is experiencing interference from mains electricity, a software band-stop filter should be applied. Eliminate the 50Hz frequency in most parts of the world or 60Hz frequency in the Americas. The APIs and Instrument Drivers, provided by Shimmer for development of software in Java/Android, LabVIEW, Matlab and C#, include the implementation of optional mains filtering in the example code.
High Pass Filtering
In order to eliminate low frequency components of the signal, high pass filtering is recommended. A cut-off frequency of 0.05 Hz is recommended for diagnostic ECG, whilst a cut-off frequency of 0.5 Hz is suitable for longer term ECG monitoring. Care should be taken in the design of filters and it should be remembered that the filters may impose the requirement for a settling time after data collection starts. The APIs and Instrument Drivers, provided by Shimmer for development of software in Java/Android, LabVIEW, Matlab and C#, include the implementation of optional high pass filtering in the example code.
4.2. Basic ECG Waveform Features
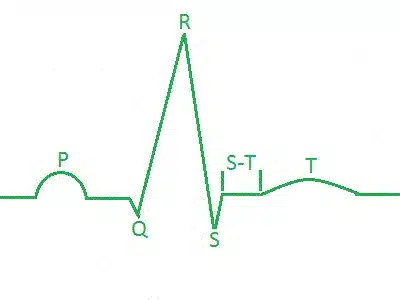
Figure 4‑1: ECG Waveform of one heart beat.
Baseline: No overall depolarization or repolarization.
P Wave: Atrial depolarization.
Duration = 80-100ms.
- PR Segment: AV nodal delay.
Duration = 120-200ms.
- QRS Complex: Ventricular depolarization (atria repolarizing simultaneously).
Duration = 80-120ms.
- ST Segment: Time during which ventricles are contracting and emptying.
Duration =70-80ms.
T Wave: Ventricular repolarization. Duration ≈200ms.
TP Interval: Time during which the ventricles are relaxing and filling. [4]
4.3. How to Determine the Heart Rate from ECG
It is a simple process to calculate heart rate (HR) in beats per minute (BPM) from the electrocardiogram using the R waves (which are part of the QRS complex described above). Shimmer’s proprietary software, ConsensysPRO implements an ECG-to-HR algorithm to give users’ access to HR from their Shimmer ECG, see Figure 4‑2 for reference.
First, make a note of the sampling rate in Hz (Fs) of the signal. Then, note the sample number of the first R wave detected (S1) and the sample number of the last R wave detected (S2). Count the total number R waves (NR) between S1 and S2, including the waves at both S1 and S2.
The HR in BMP is then given by the following equation:
HR (BPM) = 60*( NR –1)/(( S2– S1)/ Fs)
Example HR Calculation
Figure 4‑2 shows an example ECG signal with two distinct R waves and the following parameters:
NR = 2, S2 = 843, S1 = 331, Fs = 512 Hz.
HR = 60*(2-1)/((843-331)/512) = 60 BPM.
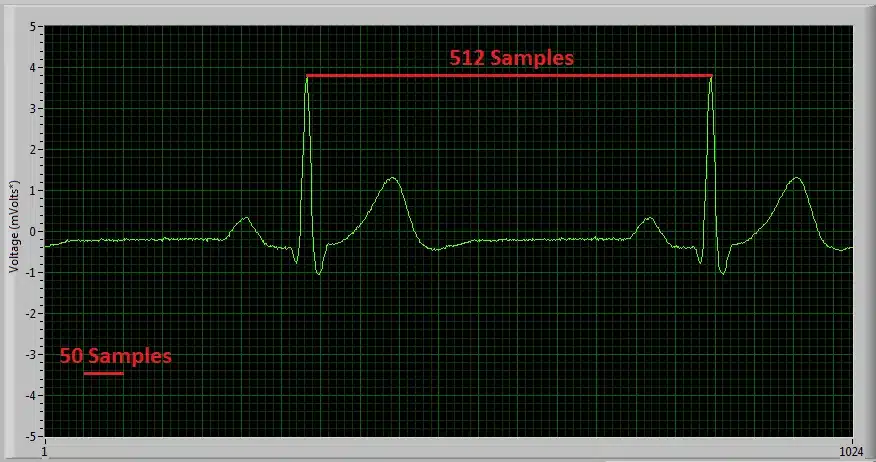
Figure 4‑2: Diagram of ECG signal captured with ‘Multi-Shimmer Sync’ for HR calculation example.
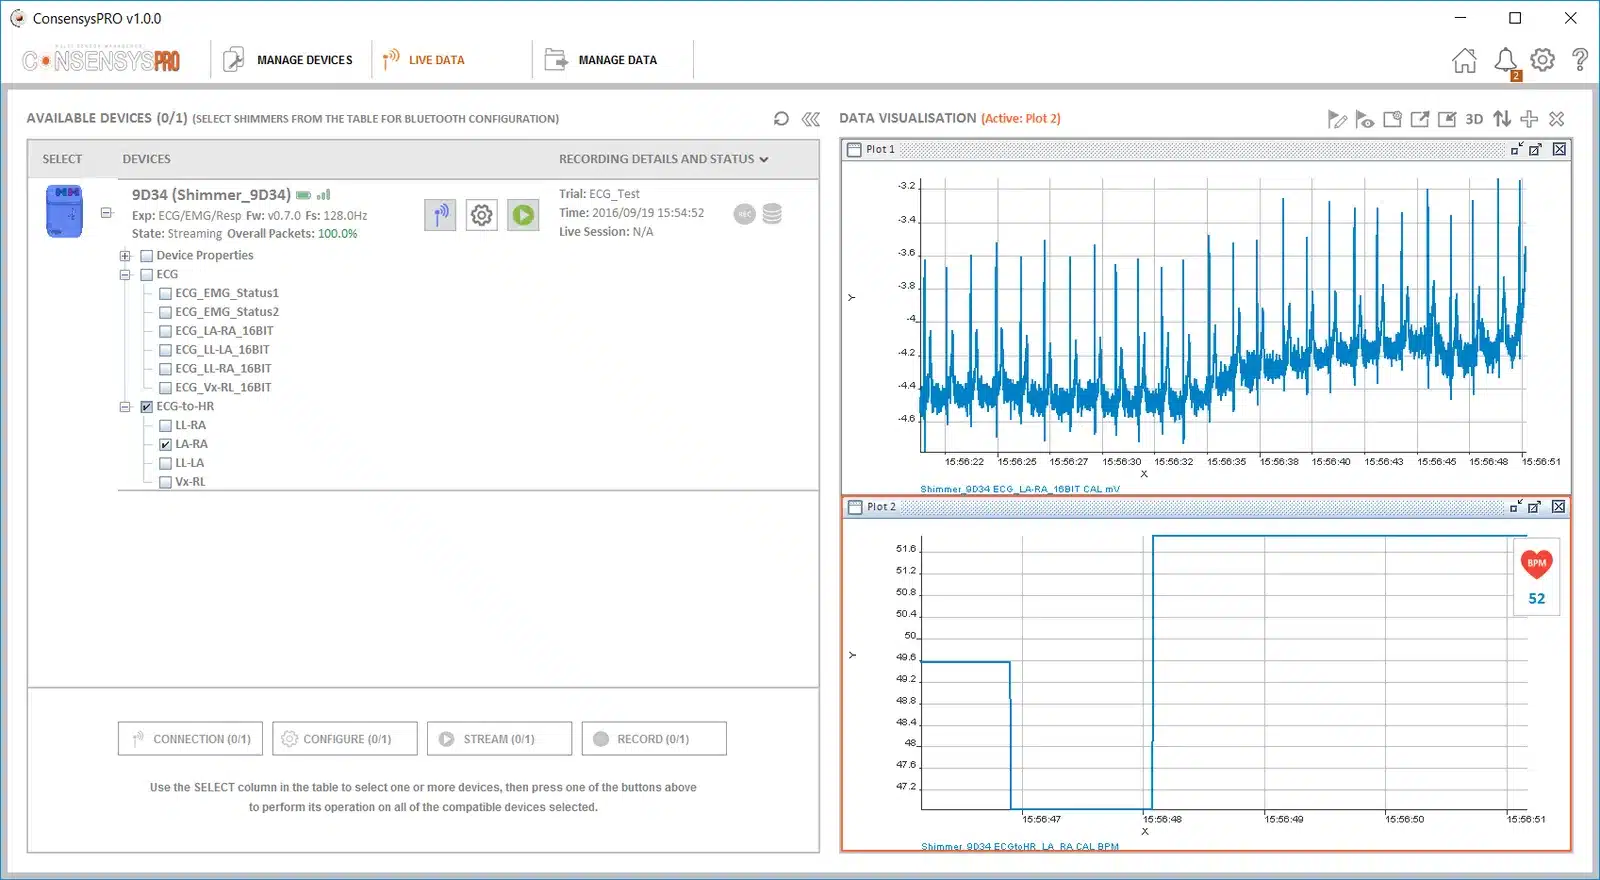
Figure 4‑3: Diagram of ECG signal and derived HR signal using ConsensysPRO software
Overview of Popular QRS Detection Methods
The following are examples of some of the most commonly used QRS detection algorithms. QRS detection algorithms are the foundation of ECG signal analysis and can be used to estimate heart rate, as shown above, among many other things. QRS detection algorithms started being developed about 40 years ago and now come in many forms. Those outlined below are intended to aid the user in getting started with investigating the topic and to direct them towards some of the appropriate literature on the subject.
Köhler et al. completed a comprehensive overview of many different techniques of software QRS detection; their paper serves as a good introduction to the subject matter [5].
Please note that free software solutions for QRS detection analysis are not currently provided by Shimmer and the information below is intended as a starting point for the new user to aid their software development. Should you require a ‘pre-packed’ software solution, please contact the Shimmer team to discuss it further (www.shimmersensing.com).
- The Pan-Tompkins Algorithm [6]
This is the most widely known real-time QRS detection algorithm. The method combines filtering, differentiator, squaring and integrator processes to detect each QRS complex. The method was developed in 1985 and is very reliable; it is no longer the state-of-the art in QRS detection but is suitable for many applications. M. Lascu and D. Lascu have published a very useful paper about implementing the algorithm in LabVIEW [7]. Portet et al. [8], among others [2, 6], have comparatively evaluated the algorithm.
- Wavelet Analysis Algorithms
Wavelet Analysis Algorithms are an increasingly popular option for QRS detection. There are multiple methods involving wavelet analysis, e.g. a multi-stage method which has shown higher sensitivity (99.93%) than the Pan-Tompkins algorithm (99.75%) [9] and the method used by Zidelmal et al. [10] involving wavelet coefficient analysis which has shown an increased positive predictivity (99.82%) in comparison to the Pan-Tompkins algorithm (99.54%). There can be advantages to wavelet analysis algorithms but they are more complex and less widely documented than the Pan-Tompkins algorithm so may require more time and expertise to implement.
- Cross-Correlation Algorithms
Cross-correlation (C-C) algorithms and multi-stage cross-correlation methods are also popular QRS detection techniques. Multi-stage C-C algorithms are particularly useful for applications where the P and T waves (see Figure 4‑1) are required to be detected in addition to the QRS complex. Last et al. [11] showed that, by including templates for each wave component, it is possible to record precise timings of each stage of the cardiac cycle. In summary, cross-correlation algorithms, in particular, multi-component based ones, allow for a high level of detail in analysis but require more computing power than simple algorithms like Pan-Tompkins and are not always suitable for real-time analysis.
- Others
Many other approaches exist in order to detect the QRS complex. These can be found by a literature search with keywords, such as ‘Neural Network Approaches’, ‘Adaptive Filters’, ‘Hidden Markov Models’, ‘Mathematical Morphology’, ‘Hilbert Transform based QRS detection’ and ‘Length and Energy Transforms’. Before selecting the methodology you wish to use, it is highly recommended that you consider the accuracy your data requires and the amount of computer processing you can facilitate.
4.4. Aliasing Error and Sampling Rate
At low sampling rates, ECG signal quality is significantly reduced. One effect of this is R wave height variation. Figure 4‑3, Figure 4‑4 and Figure 4‑5 below show a 30 BPM ECG recording at 102.4Hz, a 60 BPM recording at 204.8Hz and an 120 BPM recording at 512Hz respectively. It is noticeable that the variation in R wave height variation is minimised with increased sampling frequency. Whilst the 512Hz sampling rate allows for clinical grade signal recordings it may not be necessary for your application. If a lower sampling rate is used less data is stored saving memory space and computer usage, a higher sampling rate provides a much better replication of the real ECG signal but increases computer usage and memory used.
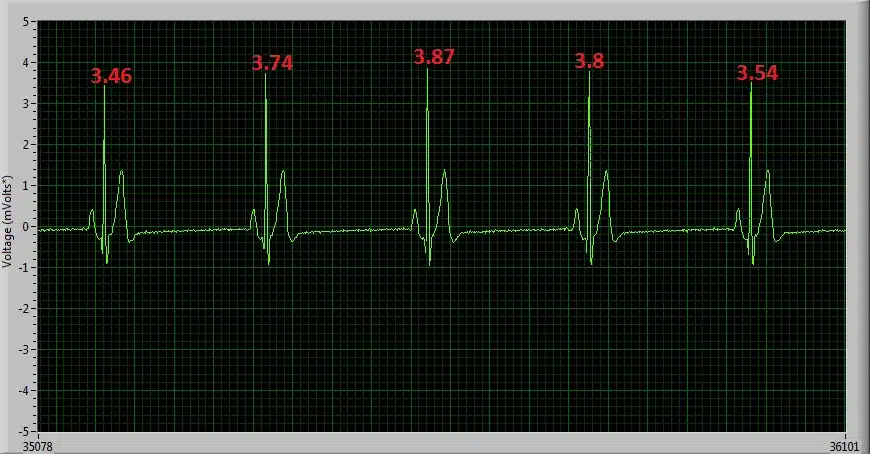
Figure 4‑3: 30 BPM ECG signal sampled at 102.4Hz, showing high R wave height variation.
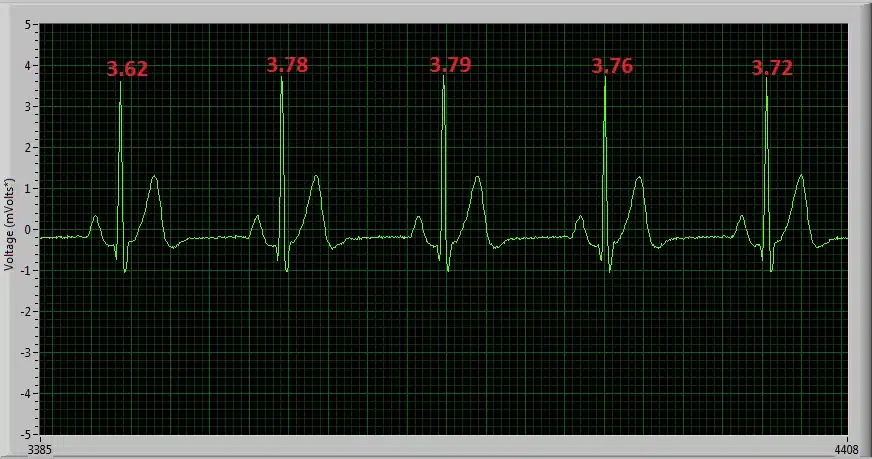
Figure 4‑4: 60 BPM ECG signal sampled at 204.8Hz, showing reduced R wave height variation.
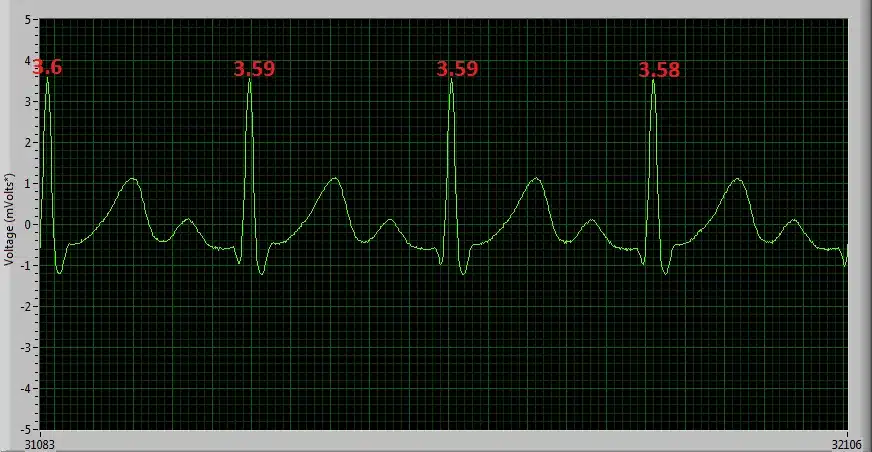
Figure 4‑5: 120 BPM ECG signal sampled at 512Hz, showing minimal R wave height variation.
4.5. Signal Calibration
The ADC output for each channel from the ECG Unit has a signed 24bit digital format. The relationship between the ADC output and the ECG Signal in mVolts is given by the formula:
$`(ADC\ Output – ADC\ Offset).ADC\ Sensitivity = ECG\ Signal\ in\ mVolts.Gain`$ Equation 1
In order to convert the ADC output signal to mVolts which is the standard unit for an ECG signal, the above formula can be rearranged as follows:
$`ECG\ Signal\ in\ mVolts = \ \frac{\left( (ADC\ Output – ADC\ Offset).ADC\ Sensitivity \right)}{Gain}`$, Equation 2
where
$`ADC\ Sensitivity = \ \frac{Vref}{ADC\ Max} = \frac{2420\ mVolts}{2^{23} – 1}`$. Equation 3
Considering that the ADC sensitivity is known and that the ADC Output is measured from the Shimmer, in order to calculate the ECG signal in mVolts, the values for the Gain and ADC Offset must simply be inserted into Equation 2.
The nominal value for the ADC offset of the ECG Unit data channels is 0 and the gain is software configurable (see Section 3.3). For most applications these values are sufficiently accurate. If improved accuracy is required for a given application, then the gain and ADC Offset of each of the ECG Unit channels can be measured.
ADC Offset Measurement
To determine the offset of each channel, the relevant inputs for that channel should be connected to each other. For example to determine the Lead II offset, the RA and LL inputs should be connected to each other. The ADC offset for the Lead II channel is then calculated as the mean ADC output on the ECG LL-RA channel of the Shimmer with the RA and LL inputs connected together. This can easily be found by saving uncalibrated data to a file and then calculating the mean value. The offset for other channels is calculated similarly.
Gain Measurement
In order to determine the gain for the ECG sensor channels, a sine wave signal from a signal generator should be applied to the sensor electrodes. The channels should be calibrated separately, with the sine wave signal applied to the appropriate pair of electrodes in each case. It is recommended to use a signal with amplitude ±1 mV approx (2 mV peak-to-peak) and frequency between 0.05Hz and 159Hz. The gain for each channel may differ.
The gain for each channel is calculated as follows
$`Gain = \ \frac{\left( (Max\ ADC\ Output – ADC\ Offset).ADC\ Sensitivity \right)}{Max\ Input\ Signal\ in\ mVolts}`$ Equation 4
where the ADC Offset and ADC Sensitivity are as defined previously, Max ADC Output is the maximum value of the uncalibrated data on the channel of interest and Max Input Signal in mVolts is the half wave amplitude of the input sine-wave signal (e.g. 1mV when using a signal of ±1 mV).
5. Hardware Considerations
5.1. Board Layout
*Note: > TODO(S3R): The board layout figures in this section show the Shimmer3 ECG Unit. Add the Shimmer3R ECG Unit layout, and confirm that the electrode connectors (J10–J15) and the channel assignment below are the same.
Note: For Shimmer3 ECG hardware purchased prior to July 2015, please refer to Appendix 9.1 of this document.
The figures in this section show the board layout for the ECG Unit, with components labelled. The two ADS1292R chips are labelled EU1 and EU2 and are referred to in the documentation as Chip1 and Chip2, respectively. The area on the board within with the orange dashed lines is the part of the circuitry of the ECG Unit that is described in this User Guide. The area on the board outside of the orange dashed lines is the circuitry of the Shimmer3, described in the Shimmer User Manual.
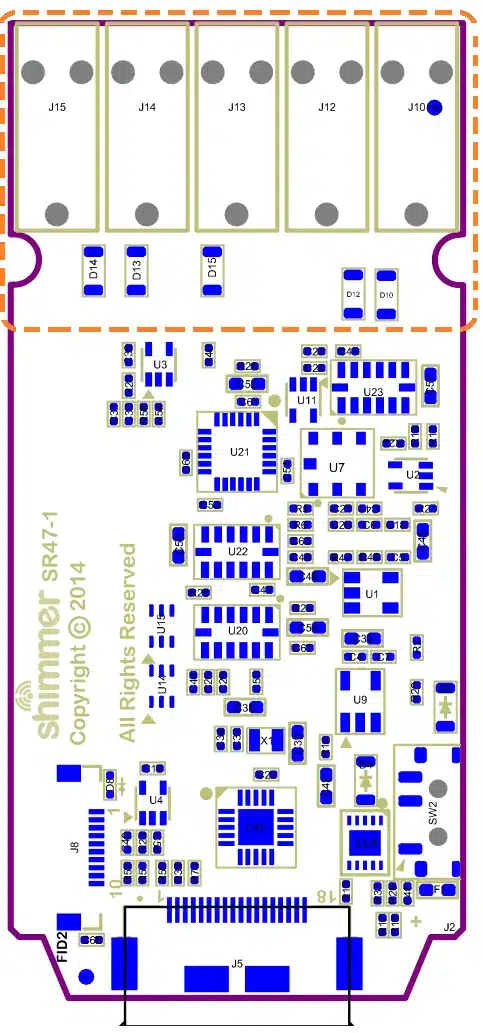
Figure 5‑1: ECG Board Layout (bottom view)
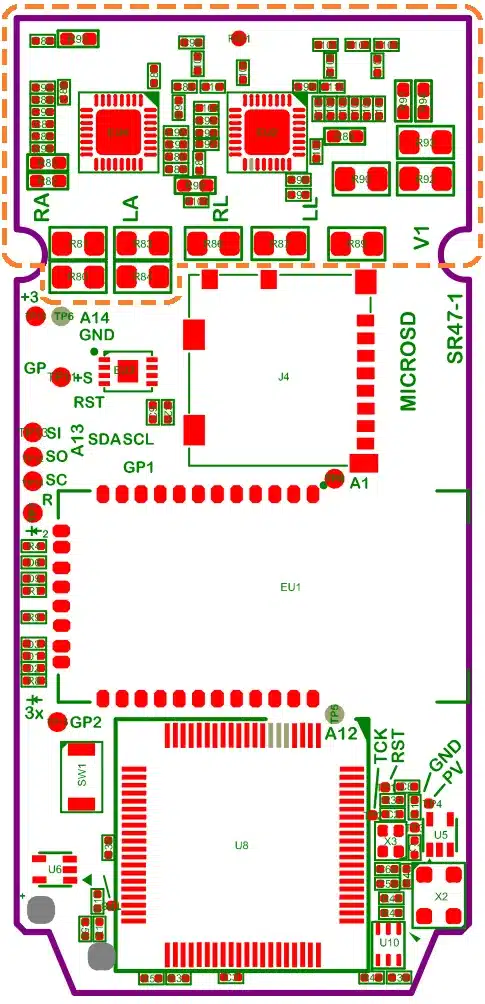
Figure 5‑2: ECG Board Layout (top view)
5.2. Channel assignment
When the MUX settings recommended in Section 3.3 of this document are configured, the channel assignment for ECG is as follows:
Chip1 Channel 1: (LL – RA) J14 (Red) – J10 (White).
Chip1 Channel 2: (LA – RA) J12 (Black) – J10 (White).
Chip2 Channel 1: Respiration demodulation (if configured, i.e. the defibrillation protection for input LA and RA has been removed).
Chip2 Channel 2: (Vx – RL) J15 (Brown) – J13 (Green).
Right-Leg Drive: J13 (Green).
5.3. Data considerations
The reference voltage for the ADS1292R chips is 2.42 V; this value should be used for conversion of raw data to voltage.
TODO(S3R): Confirm the ADS1292R reference voltage on Shimmer3R.
6. Firmware Considerations
Shimmer3R: The Shimmer3R firmware is at https://github.com/ShimmerResearch/shimmer3r-firmware. The ExG configuration bytes and data format, shared by both generations, are documented in the configuration reference and the streaming data format reference.
Users with firmware development experience who wish to develop custom firmware for the ECG Unit should follow the example provided in the LogAndStream application, source code for which is available on the Shimmer Github repository at https://github.com/ShimmerResearch/shimmer3/tree/master/apps.
7. Troubleshooting
7.1. Verifying That Your ECG Unit Works
To verify that your ECG Unit is functioning correctly, the test signal in the ADS1292R chips should be used. Please refer to Section 3.3 of this document for details on how to configure each chip to output the test signal on one or both channels. When the test signal is configured, the output of each channel should follow the signal exactly (i.e. the output should be a DC signal or a square wave at 1 Hz, with an amplitude of ±1 mV).
Using any Shimmer user interface (e.g. ShimmerCapture, Multi Shimmer Sync) you can view the signal. These and other software applications are available from the Downloads section of the Shimmer website5.
Firstly, configure the software to stream ECG data and then select sampling rate and a location to write to file. A typical ECG sampling rate is 512Hz but, for this test, you can use any desired sampling frequency. Run the software and observe the data stream. The output display should match the test signal (i.e. a DC signal or square wave depending on the configuration). If all channels are outputting the test signal properly, your ECG Unit is functioning correctly.
If the test signal is successfully transmitted to the channels but you continue to have problems with measure ECG signals, you should check electrode positioning and that the electrodes are all securely attached to both the skin and to the ECG Unit.
7.2. Signal Quality
A disconnected electrode or connector (lead-off) will adversely affect the measured ECG signal. This occurrence can be detected by the ADS1292R chip. For further information on this advanced functionality, users may refer to the ADS1292R datasheet for more details.
8. References
[1] Oster, C.D. “Improving ECG trace quality.” Biomedical Instrumentation & Technology, 2000(34), p219-222.
[2] Smith, M. “Rx for ECG monitoring artifact.” Critical Care Nurse, 1984(4), p64-66.
[3] Pizzuti GP, Cifaldi S, Nolfe G (1985) ‘Digital sampling rate and ECG analysis’.
[4] Thaler, M.S. (2007) The only EKG book you’ll ever need, 5th ed., Philadelphia: Lippincott Williams & Wilkins.
[5] Köhler BU, Hennig C, Orglmeister R. (2002). The Principles of Software QRS Detection. IEEE ENG Med Biol Mag. 21 (1), p42-57.
[6] Pan J, Tompkins WJ. (1985). A Real-Time QRS Detection Algorithm. IEEE Transactions On Biomedical Engineering. 32 (3), p230-255.
[7] Lascu M, Lascu D. (2007). ‘LabVIEW Event Detection Using Pan-Tompkins Algorithm’. SSIP’07 Proceedings of the 7th WSEAS International Conference on Signal, Speech and Image Processing, p32-37.
[8] Portet F, Hernandez AI, Carrault G. (2005). Evaluation of real-time QRS detection algorithms in variable contexts. Medical & Biological Engineering and Computing. 43 (3), p381-387.
[9] Manikandan MS, Soman KP. (2012). A novel method for detecting R-peaks in ECG signal. *Biomedical Signal Processing and Control *. 7 (2), p118-128.
[10] Zidelmal, Zahia. (2011). QRS Detection Based on Wavelet Coefficients. Computer Methods and Programs in Biomedicine. 107 (3), p490-496.
[11] Last T, Nugent CD, Owens FJ. (2004). Multi-component Based Cross Correlation Beat Detection in ECG Analysis. Biomedical Engineering OnLine. 3 (26), p1-14.
9. Appendices
9.1. Legacy Hardware
The information in this section is relevant for Shimmer3 ECG hardware purchased prior to July 2015. The figures in this section show the board layout for the ECG Module, with components labelled. The two ADS1292R chips are labelled EU1 and EU2 and are referred to in the documentation as Chip1 and Chip2, respectively.
Board Layout
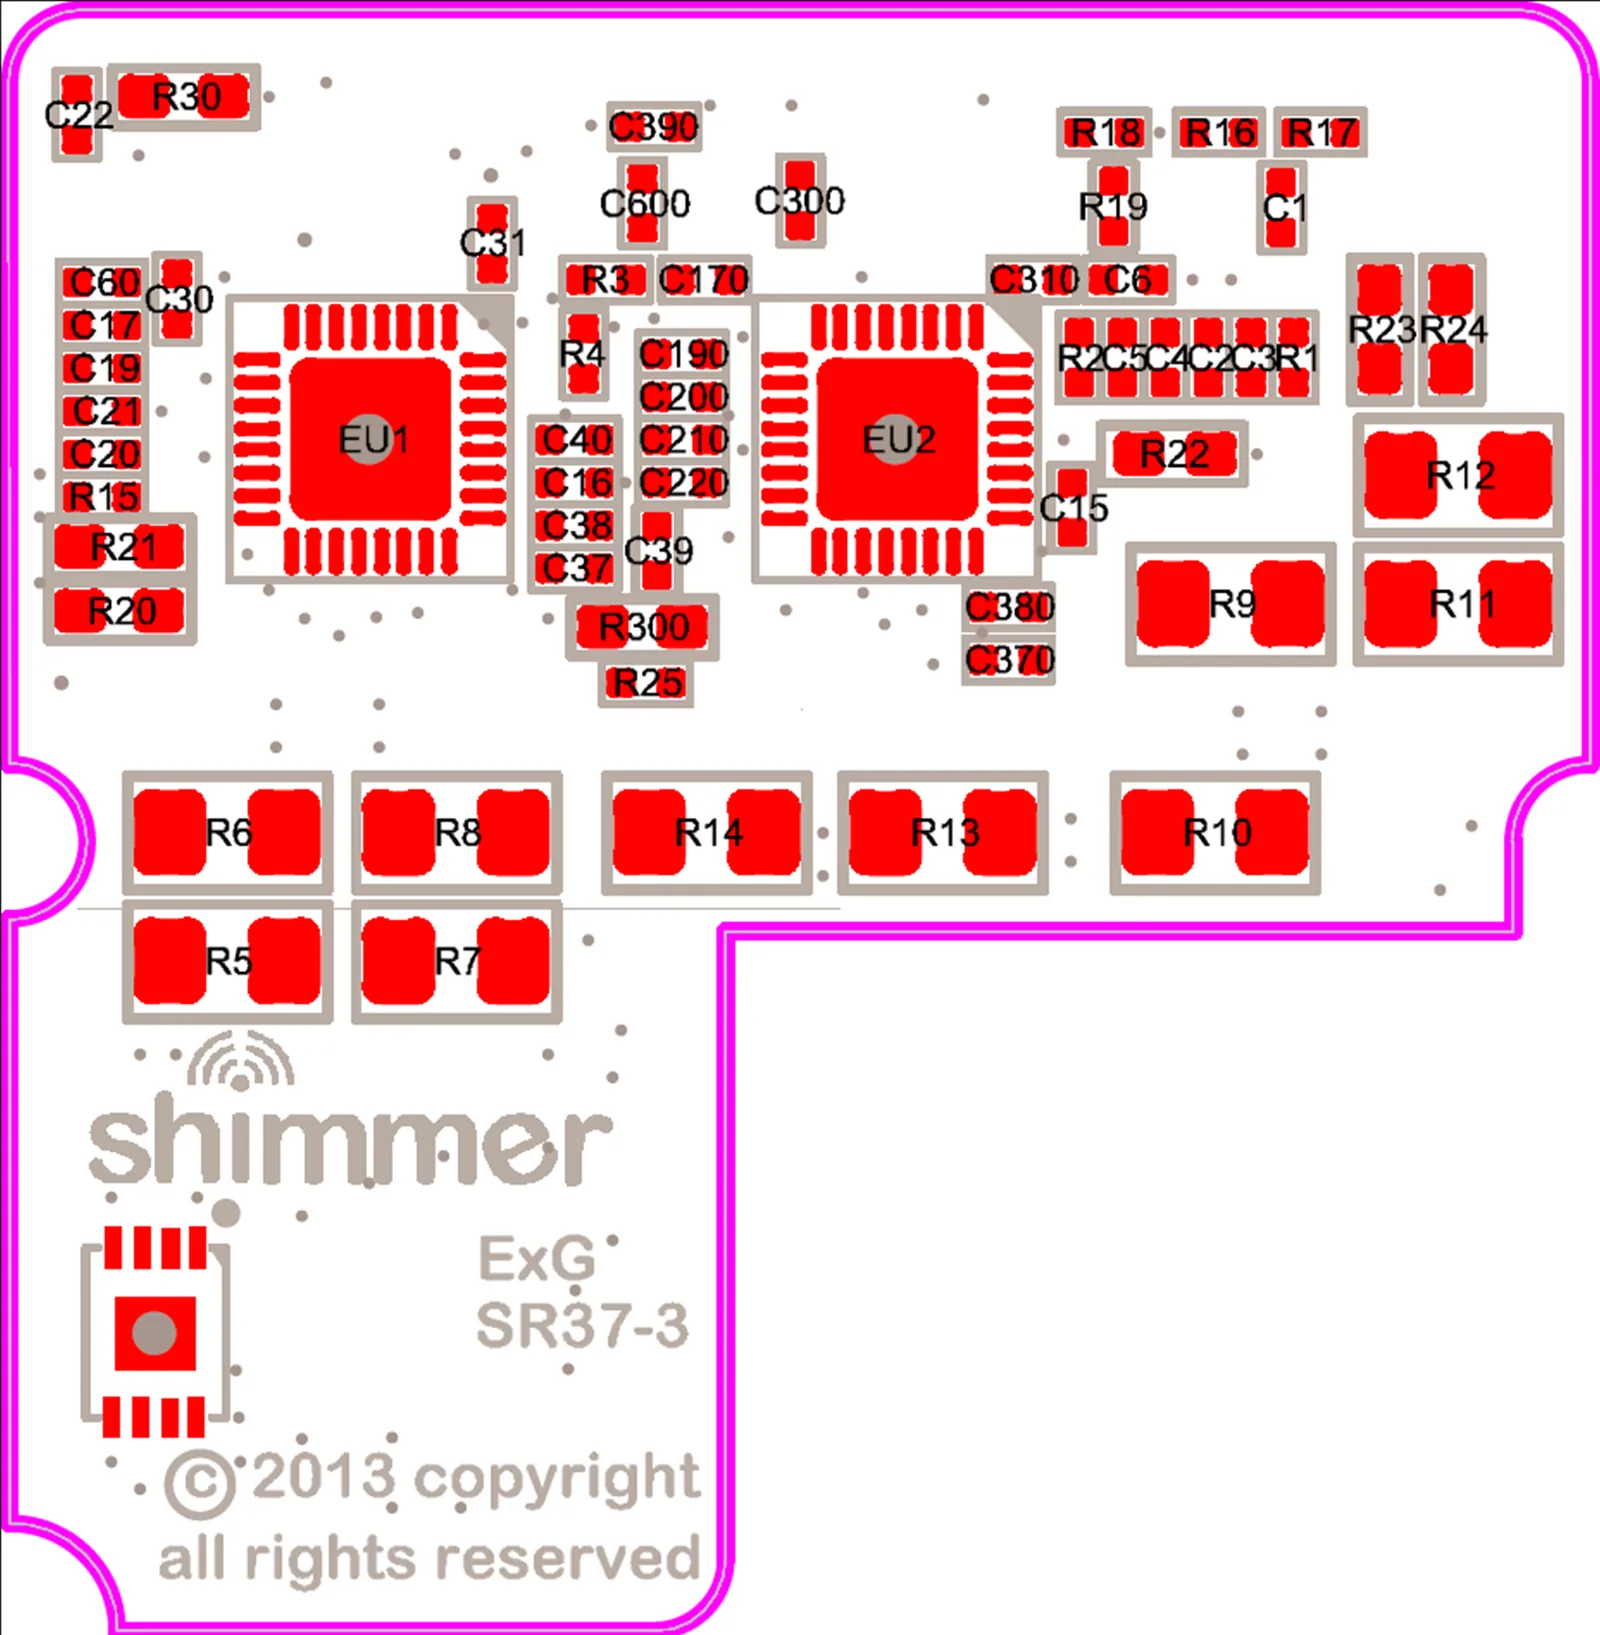
Figure 9‑1: ECG Board Layout (bottom view)
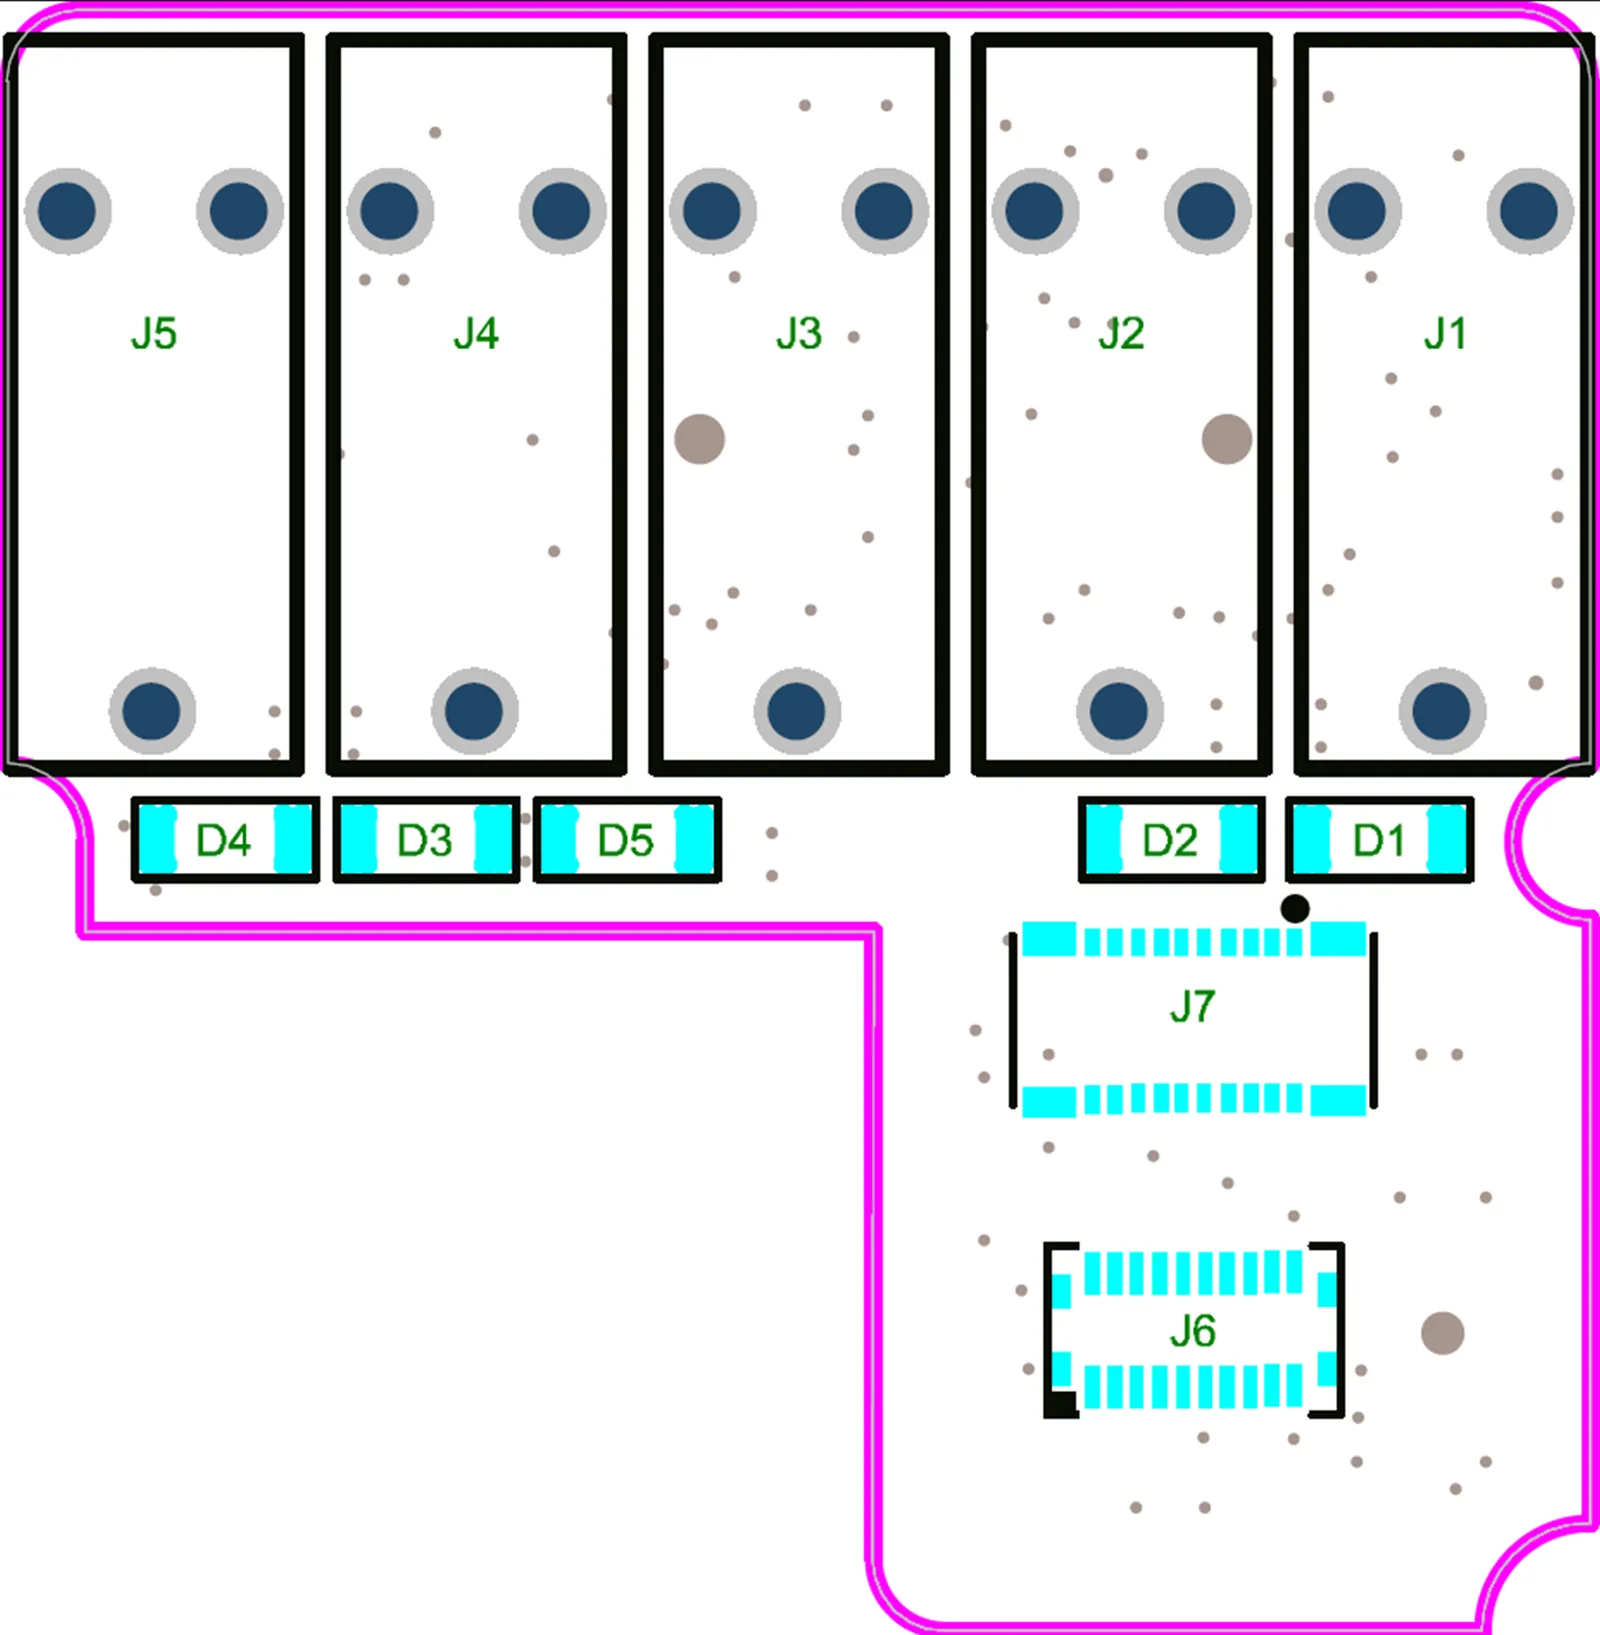
Figure 9‑2: ECG Board Layout (top view)
Channel assignment
When the MUX settings recommended in Section 3.3 of this document are configured, the channel assignment for ECG is as follows:
Chip1 Channel 1: (LL – RA) J4 (Red) – J1 (White).
Chip1 Channel 2: (LA – RA) J2 (Black) – J1 (White).
Chip2 Channel 1: Respiration demodulation (if configured).
Chip2 Channel 2: (Vx – RL) J5 (Brown) – J3 (Green).
Right-Leg Drive: J3 (Green).
Trouble shooting
Troubleshooting information that only applies to legacy hardware: If you do not see the test signal on one or all of the configured channels, you should ensure that the ECG Module is securely connected to the Shimmer3 mainboard. Please refer to Section 9.2 of this document for instructions on how to open the ECG module. You should then verify the configuration settings of your device.
For devices purchased between September 2014 and July 2015, the ECG Module is permanently fixed to the Shimmer3 mainboard. Removal of the expansion board from the mainboard should not be carried out under any circumstances. Doing so will cause damage to one or both of the boards and any necessary repairs will not be covered by warranty.
For devices purchased before September 1st, 2014, it was possible to disconnect the ECG Module from the Shimmer3 mainboard. For these devices, Shimmer recommends an adhesive to secure the connection between the Shimmer3 mainboard and Expansion Boards. The adhesive that is used by Shimmer during assembly is called Superdots (www.superdots.com). We use the Ultra Tak variety. With Superdots applied, the expansion boards can still be removed and swapped out, if required, as the adhesive does not go solid but has a rubbery consistency, allowing it to be removed. However, customers should remember that frequently removing expansion boards is not recommended and can cause damage to the connectors. Superdots also provides some shock absorbtion.
Shimmer fits the Superdots by stretching them around the edges of the Expansion Board. This ensures that the adhesive doesn’t prevent the connectors from making a good connection and there is enough adhesive to secure the boards together but not to interfere with the fit.
Note: Shimmer does not supply Superdots.
9.2. Opening the Shimmer3 expansion enclosure
Whilst the Shimmer3 enclosures can be opened to allow users to change the SD card, it is important to note that the plastic enclosures are not designed for regular opening and closing. In particular, it is recommended that the screws not be removed and reinserted on a regular basis as damage to the plastic by over-use of the screw mechanism will occur.
For (legacy) devices purchased between September 2014 and July 2015, the ECG Module is permanently fixed to the Shimmer3 mainboard. Removal of the expansion board from the mainboard should not be carried out under any circumstances. Doing so will cause damage to one or both of the boards and any necessary repairs will not be covered by warranty.
For (legacy) devices purchased before September 1st, 2014, it is possible to disconnect the ECG Module from the Shimmer3 mainboard. Please note, however, that this is not recommended.
Whether the ECG Module is permanently fixed to the Shimmer3 mainboard or not, if the enclosure must be opened to replace the SD card, care must be taken not to damage the expansion board connection, which could result in loss of communication between the expansion board and the Shimmer3 mainboard. Please refer to the Shimmer assembly video on our YouTube channel6.

Legal notices
ECG User Guide
Revision 1.12
Legal Notices and Disclaimer
Redistribution IS permitted provided that the following conditions are met:
Redistributions must retain the copyright notice, and the following disclaimer. Redistributions in electronic form must reproduce the above copyright notice, this list of conditions and the following disclaimer in the documentation and/or other materials provided with the document.
Neither the name of Shimmer Research, or Realtime Technologies Ltd. nor the names of its contributors may be used to endorse or promote products derived from this document without specific prior written permission.
THIS DOCUMENT IS PROVIDED BY THE COPYRIGHT HOLDERS AND CONTRIBUTORS “AS IS” AND ANY EXPRESS OR IMPLIED WARRANTIES, INCLUDING, BUT NOT LIMITED TO, THE IMPLIED WARRANTIES OF MERCHANTABILITY AND FITNESS FOR A PARTICULAR PURPOSE ARE DISCLAIMED. IN NO EVENT SHALL THE COPYRIGHT OWNER OR CONTRIBUTORS BE LIABLE FOR ANY DIRECT, INDIRECT, INCIDENTAL, SPECIAL, EXEMPLARY, OR CONSEQUENTIAL DAMAGES (INCLUDING, BUT NOT LIMITED TO, PROCUREMENT OF SUBSTITUTE GOODS OR SERVICES; LOSS OF USE, DATA, OR PROFITS; OR BUSINESS INTERRUPTION) HOWEVER CAUSED AND ON ANY THEORY OF LIABILITY, WHETHER IN CONTRACT, STRICT LIABILITY, OR TORT (INCLUDING NEGLIGENCE OR OTHERWISE) ARISING IN ANY WAY OUT OF THE USE OF THIS DOCUMENT, EVEN IF ADVISED OF THE POSSIBILITY OF SUCH DAMAGE.
